
Of the 15,192 homes that sold across Metro Vancouver between January and June 2026, 2,381 homes, or 15.5% of sales achieved their asking price or better. However, the chance of getting asking price is not evenly distributed over those homes’ time on market.
It makes sense that homes sitting on the market for longer would be less likely to achieve their list price. But how much do extra weeks on the market cost the seller — both in terms of the chance of getting asking, and in actual dollars?
Diminishing chances of achieving list price
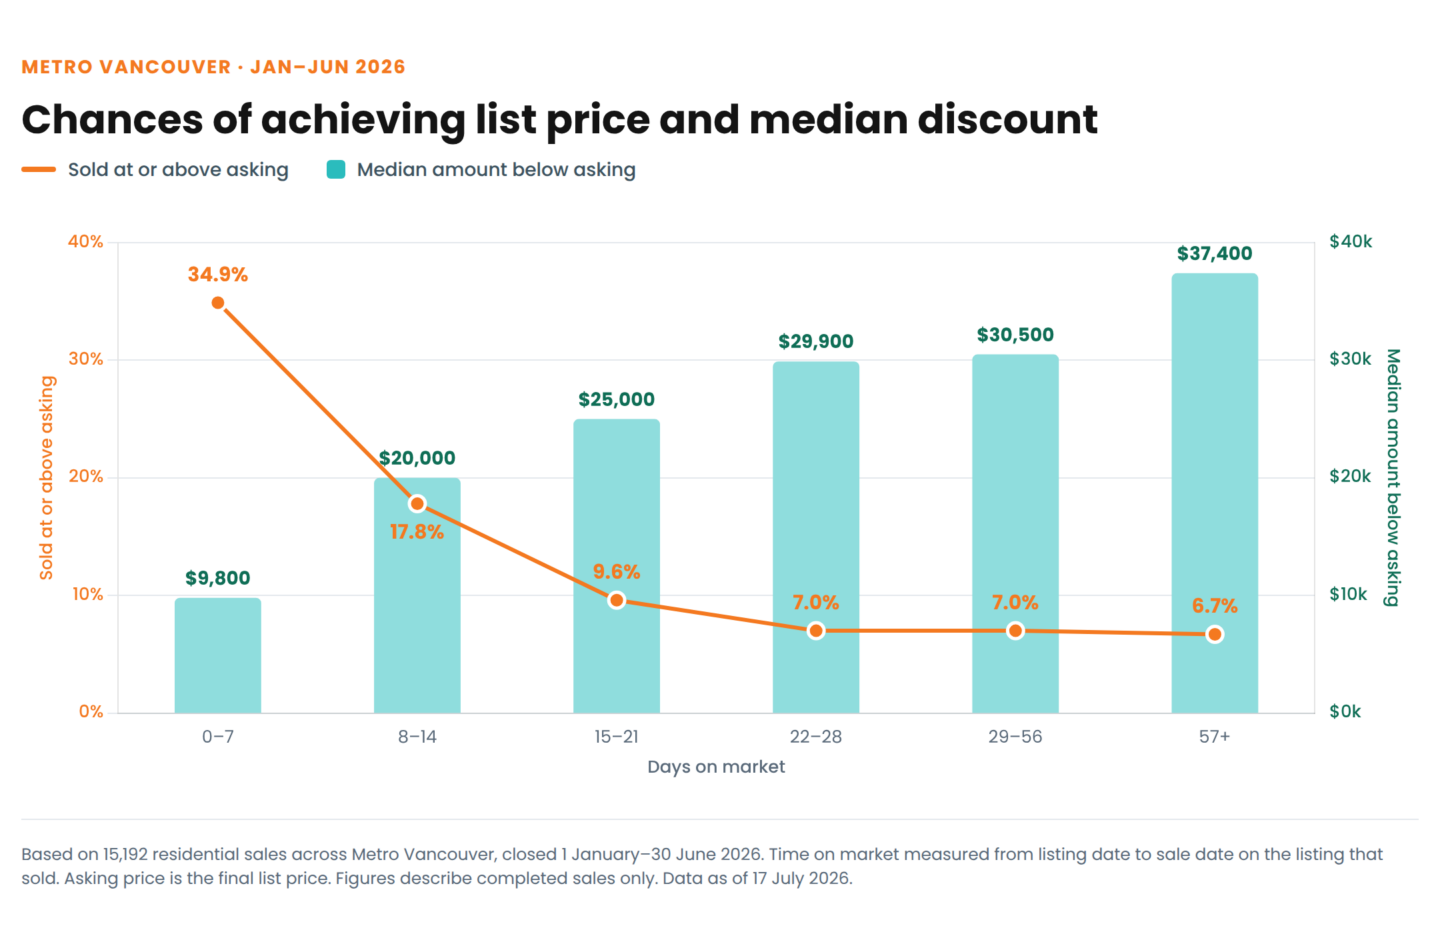
Among the 3,669 Metro Vancouver homes that sold between January 1 and June 30 this year within seven days of being listed, more than a third reached their asking price or better (1,282 sales, which is 34.9%). In the second week the rate is 17.8%. By the third week it is 9.6%.
See the latest real estate market trends Monthly stats updated for the Metro Vancouver market — filter for your individual communityOf course, a seller cannot decide to sell within a week. What the seller decides is the asking price, and the asking price produces both the speed and the result. The week-one group is largely made up of homes priced to move.
The decline levels off in weeks four to seven, and slides only a little after that:
- 22–28 days: 7.0%
- 29–56 days: 7.0%
- 57+ days: 6.7%
A home that has been listed for two months has roughly the same chance of achieving its asking price as one listed for four weeks (about one in 14, in both cases).
Clearly, selling in the first couple of weeks is most crucial for the chance of getting list price, although even then, chances are not high in today’s market.
The price gap keeps widening
While the odds begin to flatten after three full weeks on market, the amount that the seller typically has to discount off the asking price does not. The median sale price measured against the final asking price widens at every stage:
- Sold 1–7 days: median sale-to-list price −1.07% (−$9,800)
- 8–14 days: −2.41% (−$20,000)
- 15–21 days: −3.08% (−$25,000)
- 22–28 days: −3.39% (−$29,900)
- 29–56 days: −3.57% (−$30,500)
- 57+ days: −4.14% (−$37,400)
Past the one-month mark, a seller’s chance of getting asking price is no longer rapidly deteriorating, but the amount they give up when they miss it carries on climbing. The typical seller at 57 days or more accepted $37,400 below their asking price. In week one the typical shortfall was $9,800.
Digging further into the data, it is clear that this is not about expensive homes taking longer to sell and seeing bigger relative declines. Homes that sold within a week had the highest median price of any of these sale cohorts, at $995,000, and the smallest dollar gap. Every slower group sold at a median between $875,000 and $913,000.
A crucial caveat about “asking price”
The comparison being made in this report is sale price against the final asking price, which is not always the first asking price. Among Metro Vancouver homes sold in the first half of 2026, 24.3% had their asking price reduced before the sale closed. Which means that for roughly one seller in four, “reaching the asking price” means reaching a number that they had already lowered.
Also, that 24.3% counts only reductions made within a single listing. It does not account for homes that were delisted and then relisted at a lower price, because each listing is measured on its own most recent asking price.
A final note on this data is that these figures only describe homes that actually sold in this six-month period. Listings that were withdrawn or expired without a sale are not counted anywhere in them, and neither are homes still on the market waiting for a buyer. A home listed in May and still unsold today appears nowhere in these numbers, and homes in that position are the ones most likely to land in the slower groups if and when they do sell. The percentages are not the odds facing a seller at the moment they list; they describe outcomes among completed sales only.
What it all means for buyers and sellers
For sellers, the results point at the listing price rather than at any tactic applied afterwards: the homes that achieved their asking price were overwhelmingly the ones that sold quickly, and the ones that sold quickly were priced to do so, with the first two weeks accounting for 28.2% success versus 6.9% for everything past four weeks.
For buyers, a listing’s age is extremely useful information — homes sitting past a month are being bought at a median of 3.6% to 4.1% below what their sellers are asking, and that discount has been widening the longer a listing sits. Take a look at the recent article linked below to learn more about how to spot negotiating room, and what the other important data point is besides days on market.
How to spot your negotiating room on any home purchase The two data points on every HouseSigma listing that make it easy