
Whether you’re in BC, Alberta, or Ontario, if you read the local real estate news, you’ve heard it’s a buyer’s market right now.
In May, about seven in 10 homes sold for less than their asking price in Ontario and Alberta, and roughly eight in 10 in British Columbia. Across all three provinces, the average sale closed about two to three percent below list. Sellers, on the whole, are taking less than they hoped for.
The other market signals point the same way. Listings are sitting on the market longer than they were a year ago, in every major market from Metro Vancouver to the GTA. There’s more to choose from, too: Metro Vancouver alone had more than 20,000 homes for sale in May. And the bidding-war years of 2021 and 2022 are firmly behind us, at least for now.
See the latest real estate market trends Monthly stats updated for every major Canadian market — filter for your region and communitySo far, so good for buyers. But does that mean you always have negotiating room when making an offer? Is lowballing a solid blanket strategy these days?
Here’s how to tell where you actually have the upper hand — and where you don’t — before you make an offer.
“Buyer’s market” doesn’t mean every home is a deal
If you’re house-hunting this year, the broad conditions are working in your favour, but that’s not the whole story. That’s simply the broad market climate, not a guarantee for any one home. Even now, about 20-30% of homes (depending on your region) still sell at asking price or above, because enough buyers wanted them.
The trouble is that a market report can’t tell you which group the home in front of you belongs to. If you walk into a hot-commodity listing assuming you have the upper hand, you can lose it. If you walk into a quiet one without realizing how quiet it is, you might leave money on the table.
So before you make an offer, it’s worth checking where you stand on that specific home. Two numbers on every HouseSigma listing page make that very easy.
Number one: the listing’s individual popularity score
On every listing (below the comparable sold listings), there’s an individual popularity score for that home. This score rates a home out of 100 based on how much attention it’s drawing, through views and saves, compared with similar listings nearby. A high score means other buyers are watching this home, and low score means they aren’t watching it as much as other listings.
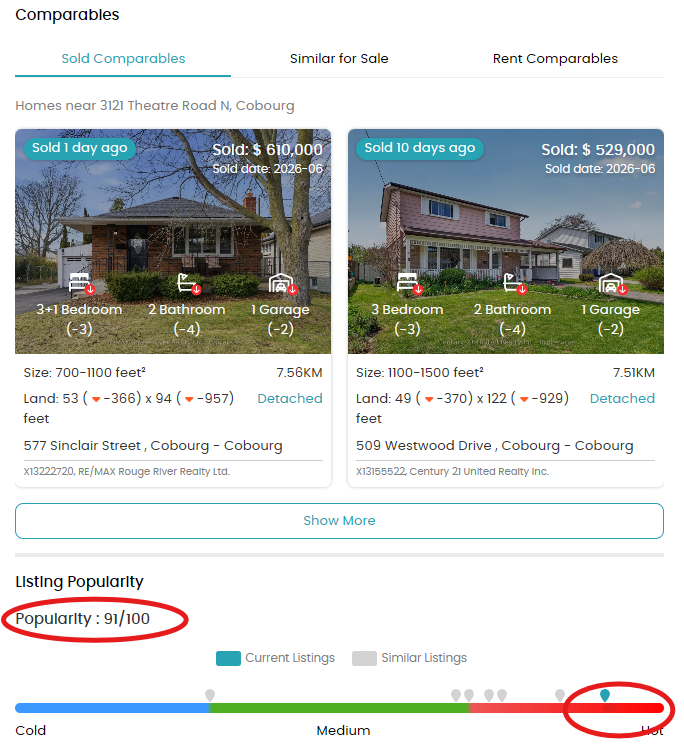
On its own, this score is a useful first read on whether you’re likely to face competition. However, attention can be nothing but noise. A home can pile up views because it’s overpriced, unusual, been shared on social media, or simply new. It doesn’t necessarily mean anyone’s actually about to make an offer. So treat the score as the start of the picture, not the whole of it.
Number two: how long it’s really been listed
Days on market tells you how long the listing has been up. This information, paired with the popularity score, is much more powerful. A home drawing steady attention that still hasn’t sold is telling you the interest isn’t converting into offers, which usually points to a price the market hasn’t accepted yet.
However, it’s worth noting that if a seller takes a stale listing down and quickly puts it back up, the days-on-market clock resets to zero. A home that’s been struggling for months can look like it only hit the market this morning.
That’s what property days on market is for. It counts the full time a property has spent trying to sell, and it doesn’t reset when a home is delisted and quickly relisted. So when a listing shows only a handful of days on market, check the property days on market beside it.
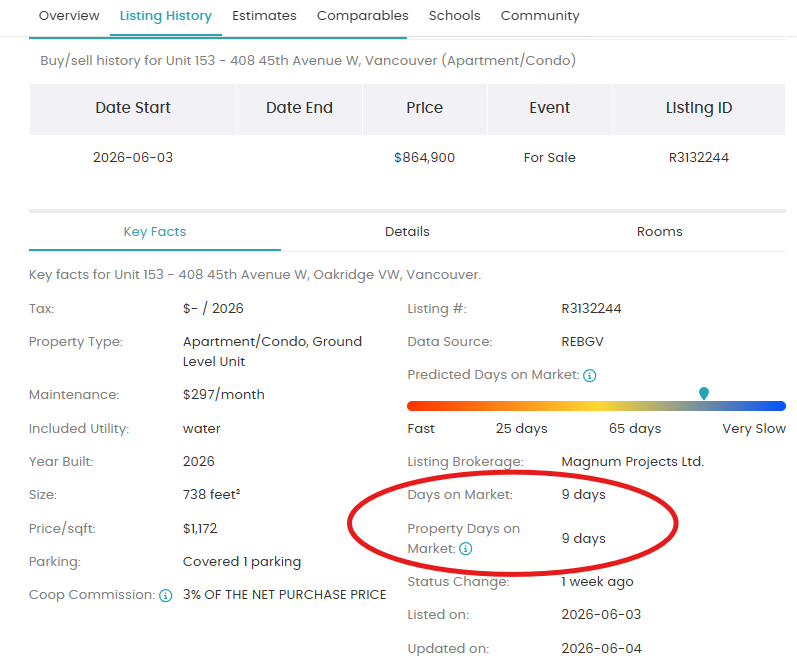
If the two match, the home really is new. If the property number is higher, you’re looking at a listing that’s been around for a while, was terminated (or expired) and reposted. That might be with a new price (check the listing history tab), or just to look fresh.
As a buyer, that data is one of the most useful signals you have. A home with a high property days on market has struggled to find a buyer, whatever the current listing says, and that often means a more motivated seller and real room to negotiate.
Reading the numbers together
Here’s how the four combinations of popularity score and property days on market play out for you as a buyer:
- Low popularity score (below 70), on the market a while: your strongest position. Few buyers are circling, and you have a concrete reason to make a confident offer under asking.
- High score, but still unsold after several weeks: the early attention never converted, usually a sign the price is too high. Watch it; a price cut may be coming, and your opening with it. If you’re really interested, an under-asking offer may work.
- High score, only just listed: the ambiguous case. Early attention can be real competition or just the noise we mentioned above, and you might not be able to tell which yet. Is it an unusual property? Did it get shared on social media because of a quirk in pricing or the home itself? Check the asking price against recent comparable sales — if it’s sharp, and the home has no obvious quirks that would account for the attention, treat the interest as likely real and get your number ready to move. If the price is above the comps, the attention may fade and the home may sit. Don’t let the score alone push you into overpaying.
- Low score, just listed: too early to read. Check back in a week or two and see whether interest builds. If it doesn’t, this takes us up to the first bullet point.
Check before you make any offer
When you find a home you like, take a minute to look at both the home’s popularity score and its Property Days on Market, side by side. Ask whether the attention matches the time on market, and what that tells you about competition. Then decide whether this is a home to push on with a lower offer, or one to chase before someone else does.
None of this replaces a good agent or a close look at comparable sales nearby. It simply gives you a faster, clearer read on your own position, so you’re not guessing.
Sammy Kohn, a leading HouseSigma agent in the Greater Toronto Area, said, “It’s a buyer’s market, but exceptions do happen. A unit my buyer client loved, sold before we could see it. It was priced appropriately from the get-go with competitive cost per square foot. Clearly the seller was well informed.
“I also see that a first offer often triggers more offers, even with homes that have a high days on market, confirming buyers taking a wait-and-see approach until another offer stimulates their buying decision.
“I always tell my buyers: if you love a place and would regret seeing it go to someone else at a price you would have paid, it’s time to act.”
Making it work for you
It’s always worth remembering that a buyer’s market only hands you leverage on average. It doesn’t spread that leverage evenly. The homes where you have the most room are the ones nobody else has noticed yet; the homes where you have the least room are the ones already drawing a crowd.
Knowing which is which, listing by listing, is what turns a general advantage into a better offer, and often a better price.
Browse homes for sale near you Updated continuously from MLS feeds across Canada — filter for your region and community