Calgary’s housing market gave buyers the upper hand in May. The advantage was real across the board, but its size depended heavily on what buyers were chasing, and where.
The typical home across the Calgary region sold for $595,000 last month, unchanged from a year earlier and down slightly from April’s $600,000. However, that steady headline figure hid a market splitting along property lines.
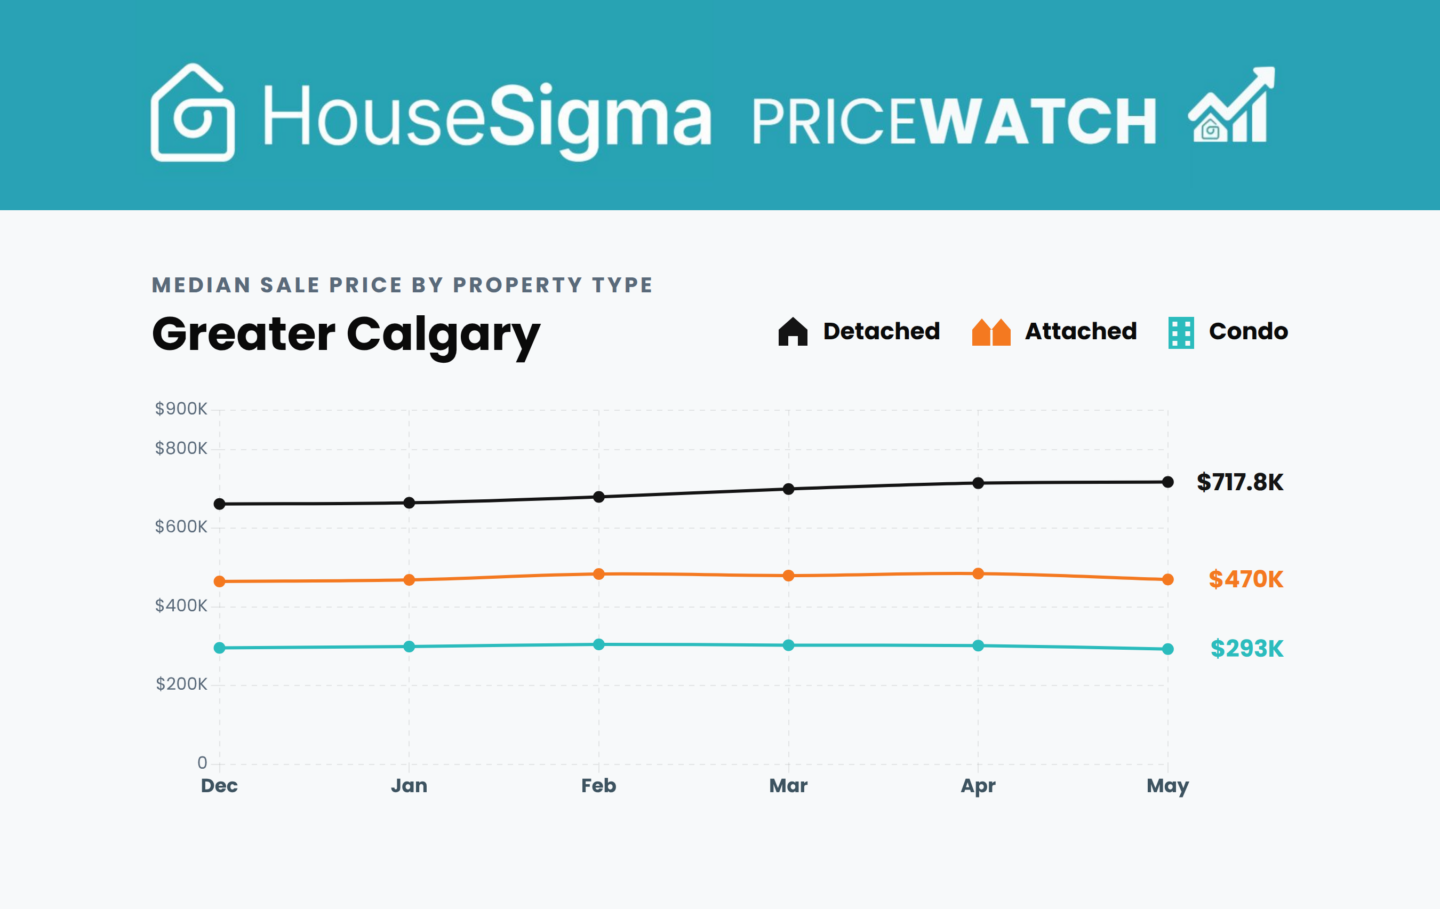
Detached houses kept edging higher on a monthly basis, reaching a median of $717,800 after rising in each of the past several months, although this price is still 1.7% lower than a year ago. Condo apartments went the other way, slipping to $293,000, the lowest figure in months and down 7.6% year over year. Attached homes landed in between at $470,000, down 5.5% year over year.
How to spot your negotiating room on any home purchase The two data points on every HouseSigma listing that make it easySale vs list prices
About 77% of homes across the region sold for less than their list price in May, and the typical sale closed around $9,900 below asking, at a median discount of just under 2%.
That gap ran deepest at the more affordable end. The median Greater Calgary condo sold 2.8% under list, a wider markdown than attached homes at 1.8% or detached houses at 1.6%.
Condos are both the softest segment on price and the one where sellers are conceding the most ground, so buyers shopping there found lower prices and lighter competition at the same time.
Regional trends
The buyer-friendly conditions weren’t confined to the city. The Greater Calgary region runs from the mountain town of Canmore, comfortably the most expensive area, out to far more affordable towns on the surrounding prairies, and prices swing enormously from one community to the next.
What held almost everywhere in May was the direction: more homes for buyers to choose from, and a clear majority selling below their asking price. Several communities outside the city saw an even larger share of sales close under list than Calgary itself did (see infographic below), so the negotiating room on offer wasn’t a city-only story.
The month’s biggest outliers
A region-wide average still says nothing about any single home. Roughly one in six Calgary-area sales closed above asking in May, proof that plenty of properties drew enough interest to push past their list price.
The spread between the strongest and weakest results was wide. One acreage property in Rocky View County, listed at $1.275 million, sold for $1.68 million, which is $405,000, or nearly 32%, over asking. In Calgary itself, a half-duplex listed at $399,900 sold for $290,000, about 27% under. Two properties selling in the same month and same region can create opposite results.
That unevenness is the catch in any buyer’s market. The favourable conditions are a regional average, and averages don’t apply evenly to every listing. Some homes still attract competing offers while others sit for weeks. Working out where a specific home falls takes more than the monthly stats, and this is what we cover in a separate guide: How to spot your negotiating room on any home purchase in 2026.
What it all means for buyers and sellers
For buyers, May’s figures confirm the advantage is real, with most homes selling below asking and condos in particular leaving room to negotiate. But that advantage shows up home by home rather than across the board, so the trick is identifying which listings have actually lost momentum before making an offer.
For sellers, the same numbers underline that realistic pricing matters more than ever, since the homes that drew offers above asking were the ones priced to attract attention, while those set too high are the listings now sitting and often selling for well below where they began.
Check out the full Calgary May 2026 PriceWatch infographic below for more details and breakdowns by area and property type. Mouseover or touch the price chart points to reveal the full data.
See the latest real estate market trends Monthly stats updated for the Greater Calgary market — filter for your individual community