Of the 15,192 homes that sold across Metro Vancouver between January and June 2026, 2,381 homes, or 15.5% of sales achieved their asking price or
Read more
Of the 15,192 homes that sold across Metro Vancouver between January and June 2026, 2,381 homes, or 15.5% of sales achieved their asking price or
Read more
In a softer market, most Metro Vancouver sellers face a final sale price that lands below expectations, and a few extra weeks of waiting before
Read more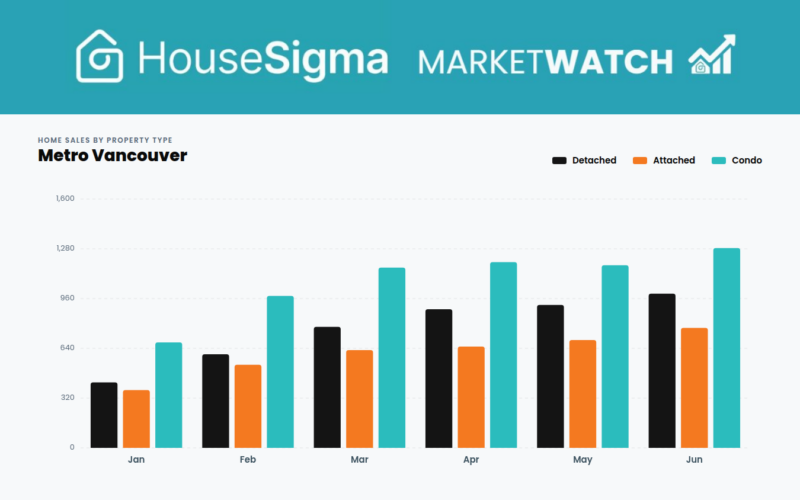
Real estate is notorious for having price changes lag sales patterns, and this was evidenced once more in June’s sale and price figures for Metro
Read more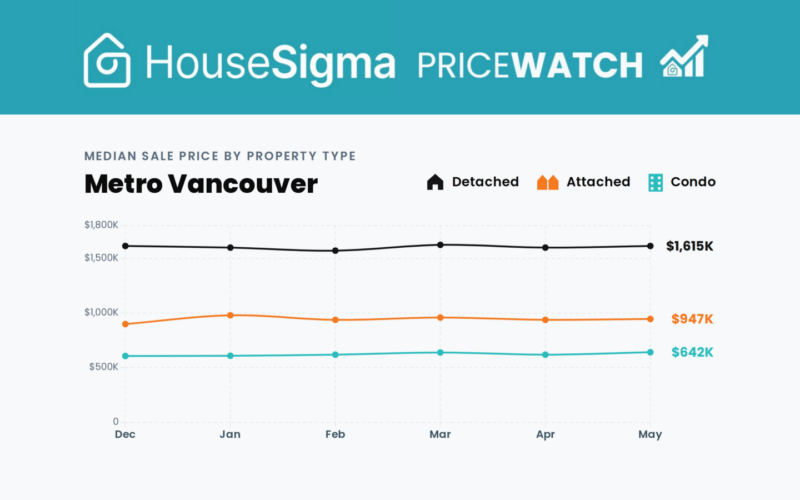
The Bank of Canada held its policy rate at 2.25% on June 10, the fifth straight decision to leave it unchanged and the level it
Read more
We’ve all heard that Metro Vancouver real estate prices have fallen across the board, and have been sliding since the spring 2022 post-pandemic peak. Four
Read more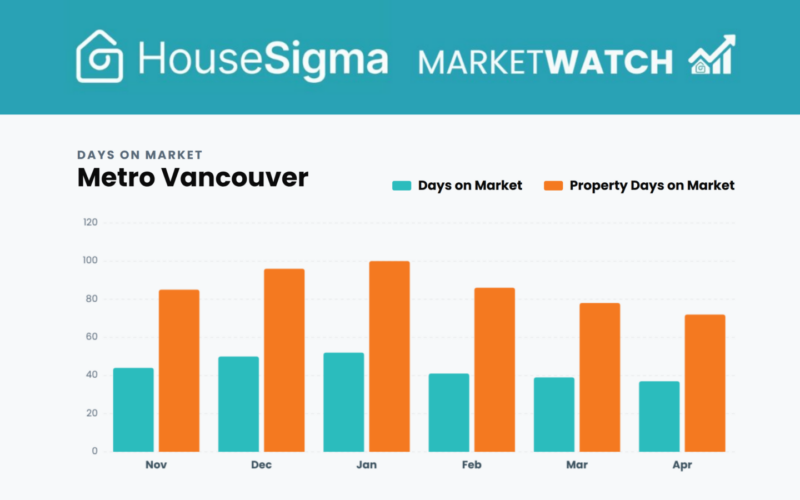
In Metro Vancouver real estate, April 2026 looked routine on the surface, at least according to the new normal. HouseSigma’s latest MarketWatch infographic (see below)
Read more
The biggest residential sale of Q1 2026 in Metro Vancouver was no ordinary transaction. The $28 million sale of a Point Grey Road waterfront estate
Read more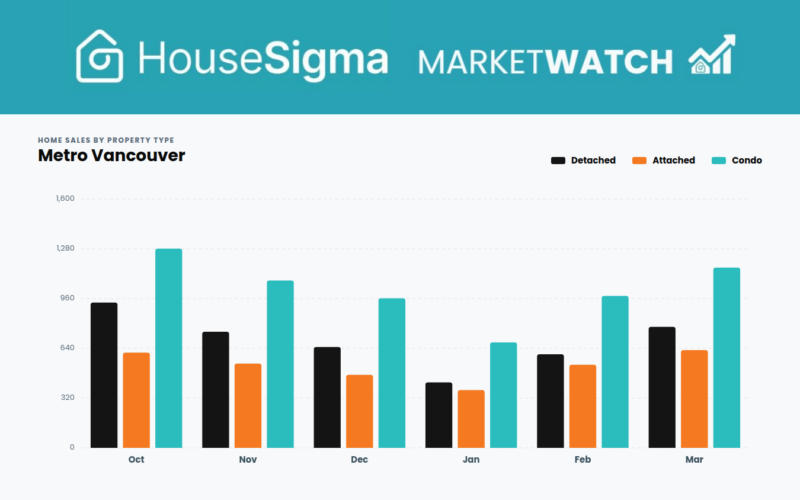
Home sales in Metro Vancouver jumped 22% from February to March. If you stopped reading there, you might think the spring market was off to
Read more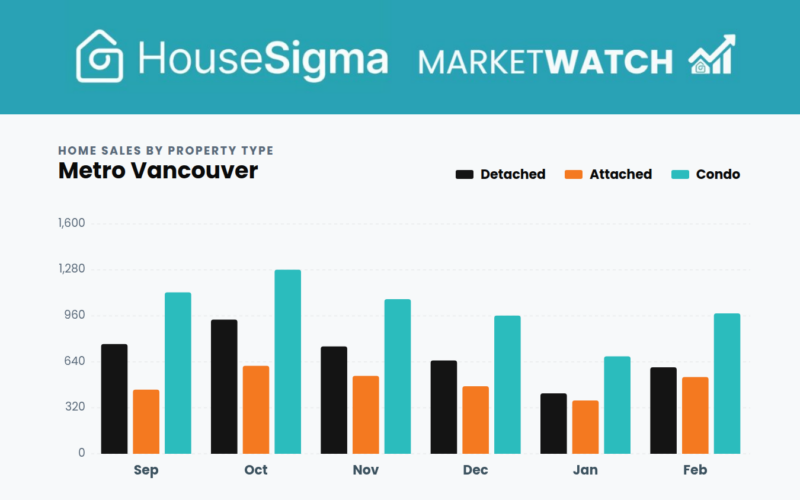
After a slow 2025 for Metro Vancouver home sales and an even slower January, February 2026 delivered a significant jolt to the market. New HouseSigma
Read more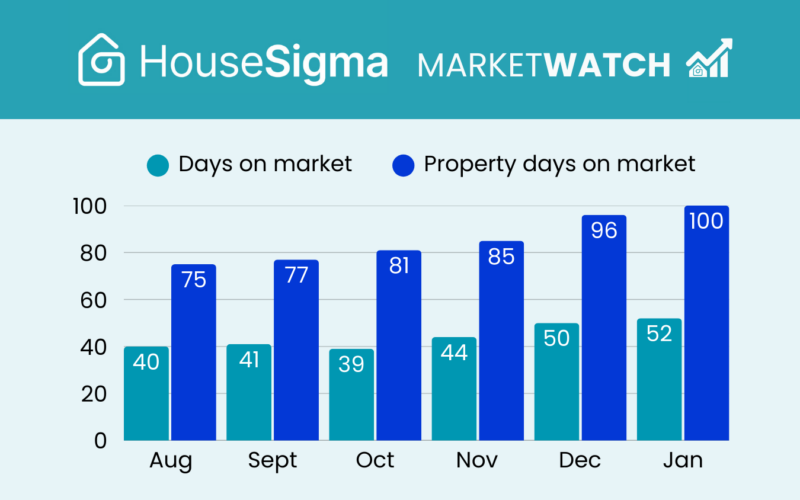
With home sales plummeting in January and fresh inventory on the market, it’s no wonder that homes in the region are taking longer than ever
Read more