
Summer is always a slow period for home listings, but this August was even slower than usual.
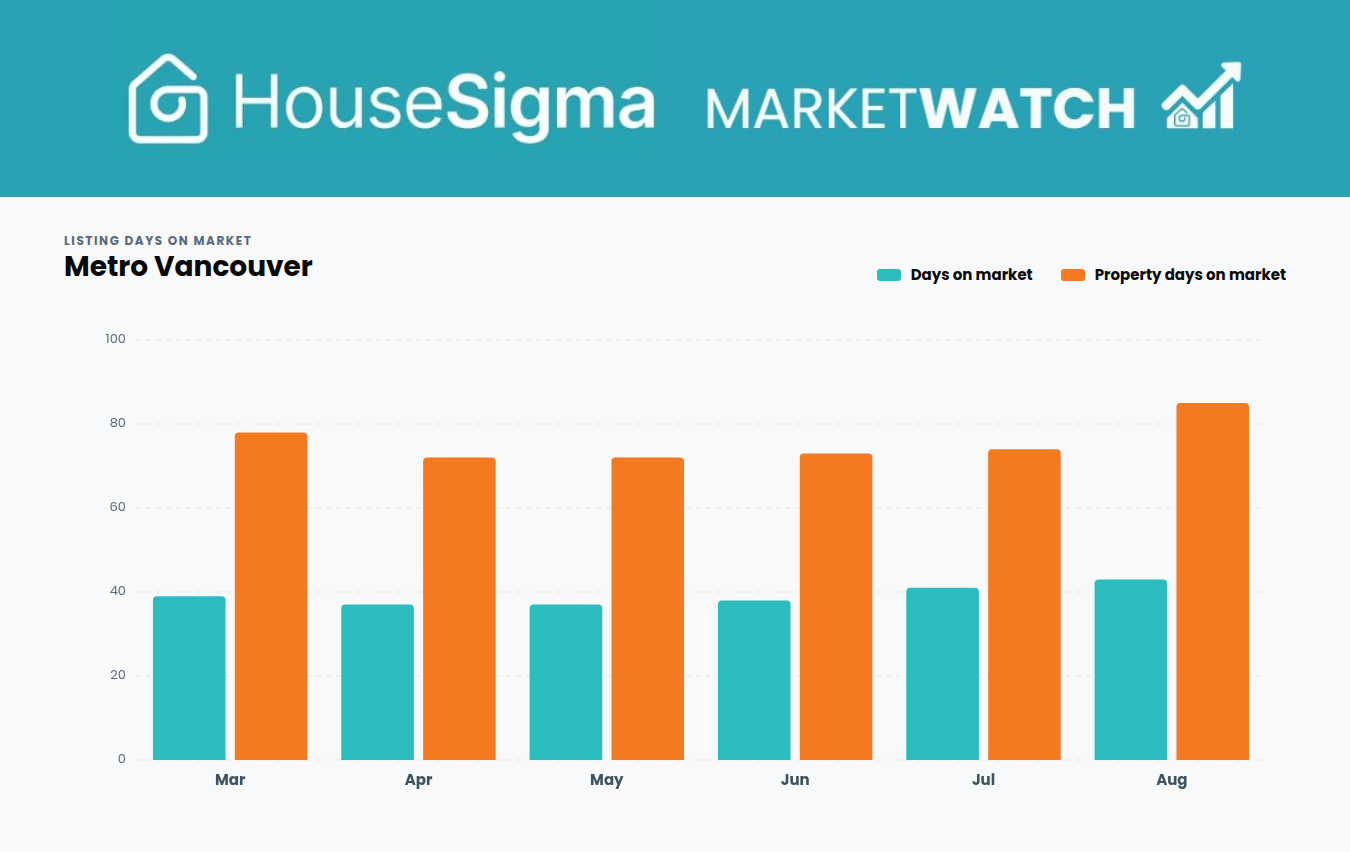
New data from HouseSigma has found that homes for sale in Metro Vancouver were on the market an average of 85 days as of the end of August 2026, when counting time carried over from earlier listings of the same property (see infographic below). That is up from 75 days last August and 59 the August before, and the longest for any August since HouseSigma began tracking the measure in 2020.
The measure is “property days on market,” which follows a home’s entire sale campaign rather than a single listing, so when a property is withdrawn and quickly put back up under a fresh listing number, the clock keeps running. Conventional “days on market” starts again at zero each time a home is listed. Both figures describe homes actively for sale as of the end of the month, rather than homes that sold in that month.
Sales, overall and by home type
Metro Vancouver recorded 2,388 residential sales in August, down 11.5% from July and 1.6% below August 2025. That is a far smaller annual gap than July’s, when sales came in 9.2% under the previous year.
The gap splits when breaking it out by property type:
- Detached sales fell 15.5% from July to 747, which still leaves them 1.1% ahead of last August.
- Attached sales came in at 591, down 12.7% on the month but up 1.9% on the year.
- Condos dropped 7.0% from July to 1,039, the smallest monthly decline of the three, but they were 5.1% below last August, making them the only type down year over year.
Median prices by property type
The overall median sale price was $918,500 in August, up 1.0% from July and down 2.4% from August 2025. Against last year, every property type fell further than that.
Detached median prices slipped 0.7% from July to $1,559,000 and were down 4.8% on the year. Attached median prices rose 2.2% to $920,000 but sat 6.6% below last August. Condo apartment median prices rose 1.8% to $611,000, also 6.6% down year over year.
The overall regional figure is the midpoint of all sales pooled together, so it reflects the mix of what sold as well as what those homes were worth. That makes it a poor guide to any single segment. Anyone watching only the overall median price sees a 2.4% decline, whereas buyers and sellers within each property type are dealing with drops from nearly 5% to 6.6%.
Current inventory and new listings
Metro Vancouver’s home inventory continued to contract in August. New listings totalled 5,610 in August, down 15.7% from July and 6.6% below August 2025. Active listings stood at 20,462 at month end, down 4.0% from July.
Sellers terminated or expired 3,970 listings across the three property types: 1,449 detached, 881 attached and 1,640 condo apartments. That is 24% more than the 3,201 withdrawn last August, with attached homes withdrawals up 36.8% year over year, detached 22.9% and condos 19.0%. A listing that is terminated, relisted and terminated again counts each time, so the figure tracks listing events rather than individual sellers or individual homes.
The sales-to-active listings ratio, which is the proportion of available homes that sold during the month, was 11.7% in August against 12.7% in July.
What it all means for buyers and sellers
Property days on market is the number to check before making an offer. A listing showing 12 days may be a home that has been available since spring under an earlier number, which changes how much room there is to negotiate. HouseSigma tracks that history at the property level, so the full run shows rather than the current listing’s age. With more than 20,000 active listings and fewer than one in eight selling in August, there is time to look and reason to ask why a home has not sold.
How to spot your negotiating room on any home purchase The two data points on every HouseSigma listing that make it easyFor sellers, it’s crucial to remember that withdrawing a listing and reposting it under a new number does not reset what buyers can see. Close to 4,000 listings came off the market in August without selling, a quarter more than last August, which suggests many sellers are waiting rather than meeting the current market. Waiting is a reasonable call, but it does not clear the time already attached to the property.
It’s also worth remembering, given the falling prices, homes in any category priced to last year’s expectations are the ones pushing that 85-day average up.
Check out the full Metro Vancouver August 2026 MarketWatch infographic below for more details and breakdowns by area and property type. Mouseover or touch the price chart points to reveal the full data.
See the latest real estate market trends Monthly stats updated for the Metro Vancouver market — filter for your community