It’s common sense that the longer a home takes to sell, the more likely it will sell for below asking price. But how long it
Read more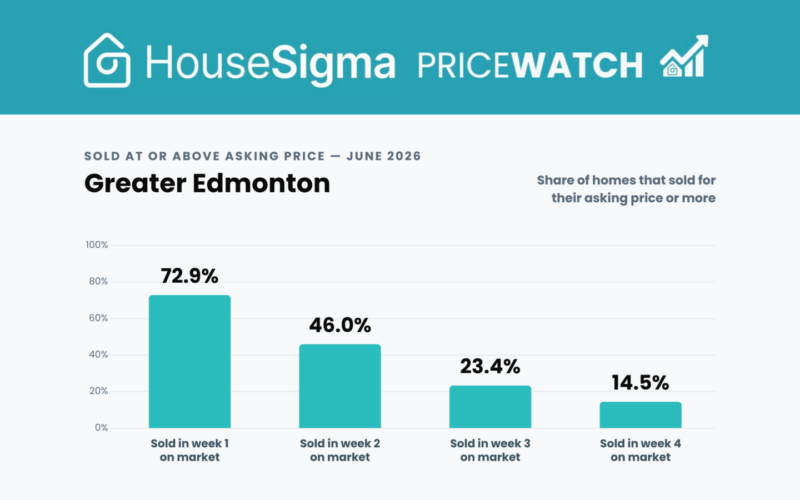
It’s common sense that the longer a home takes to sell, the more likely it will sell for below asking price. But how long it
Read more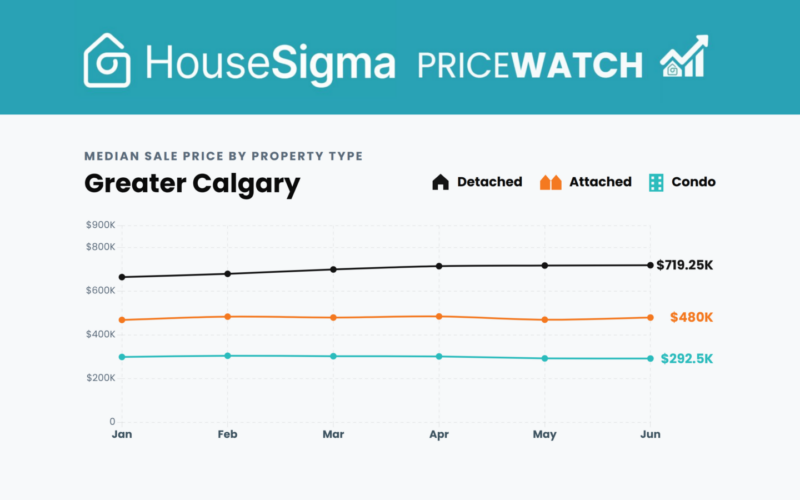
Greater Calgary’s median home sale price in June 2026 was $600,000. In June 2025 it was $600,500. Twelve months of buying and selling, and the
Read more
In a softer market, most Metro Vancouver sellers face a final sale price that lands below expectations, and a few extra weeks of waiting before
Read more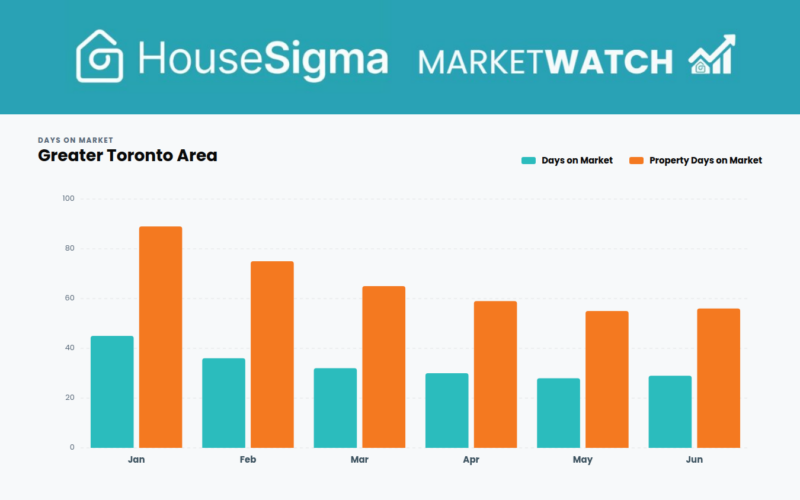
By now, most of you watching the market will have read that sales in the Greater Toronto Area were up in June, compared with a
Read more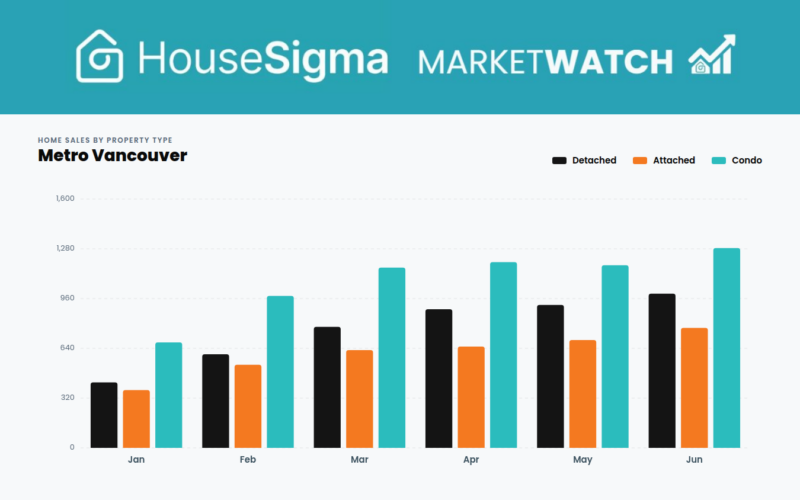
Real estate is notorious for having price changes lag sales patterns, and this was evidenced once more in June’s sale and price figures for Metro
Read more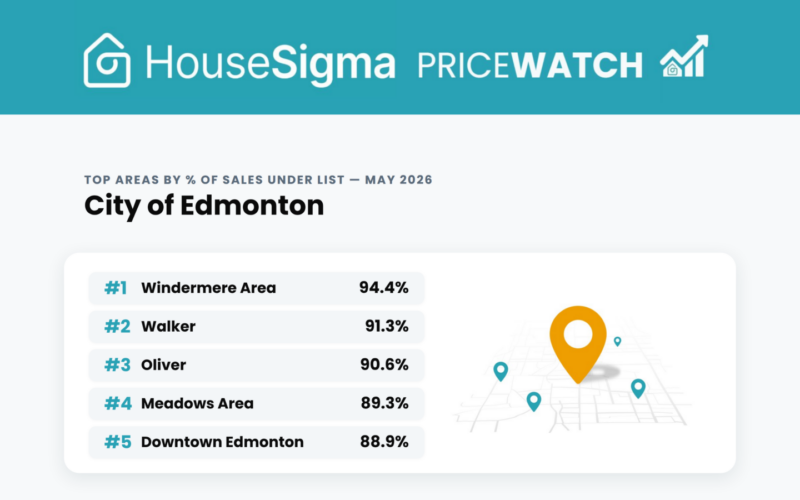
Most Edmonton-area homes sold for less than their asking price in May 2026, as buyers retained the market advantage. However, whether a deep discount was
Read more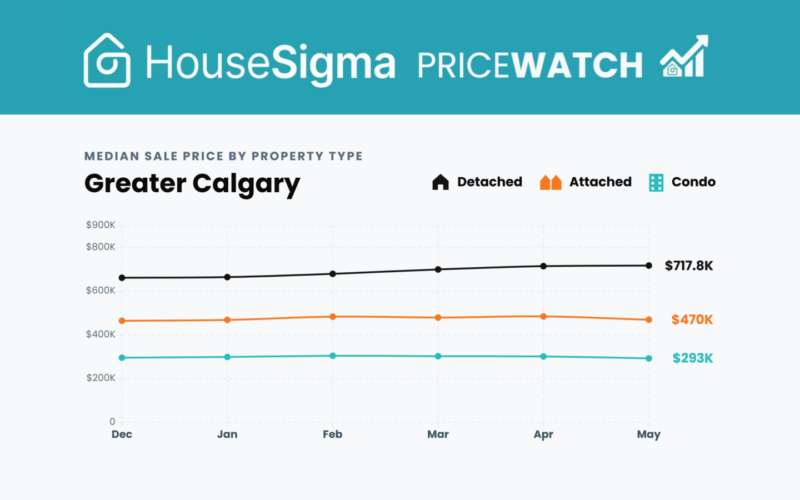
Calgary’s housing market gave buyers the upper hand in May. The advantage was real across the board, but its size depended heavily on what buyers
Read more
Whether you’re in BC, Alberta, or Ontario, if you read the local real estate news, you’ve heard it’s a buyer’s market right now. In May,
Read more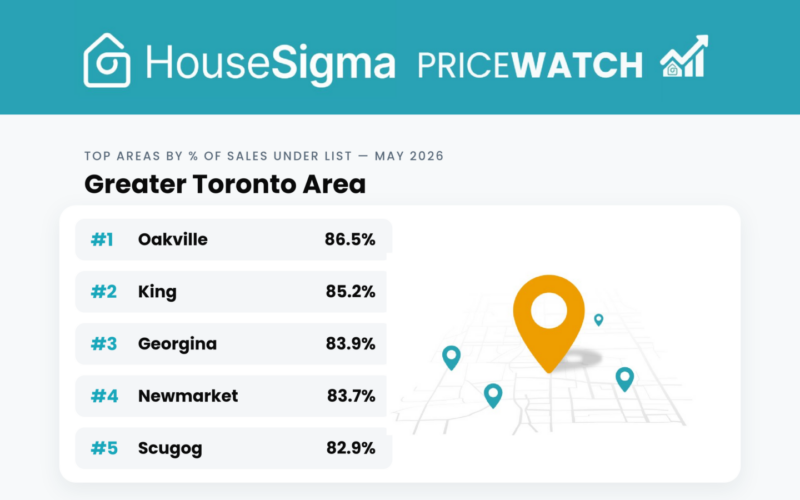
In a hot housing market, the cheapest homes are usually the most fought over. The Greater Toronto Area in May was the reverse. Condos are
Read more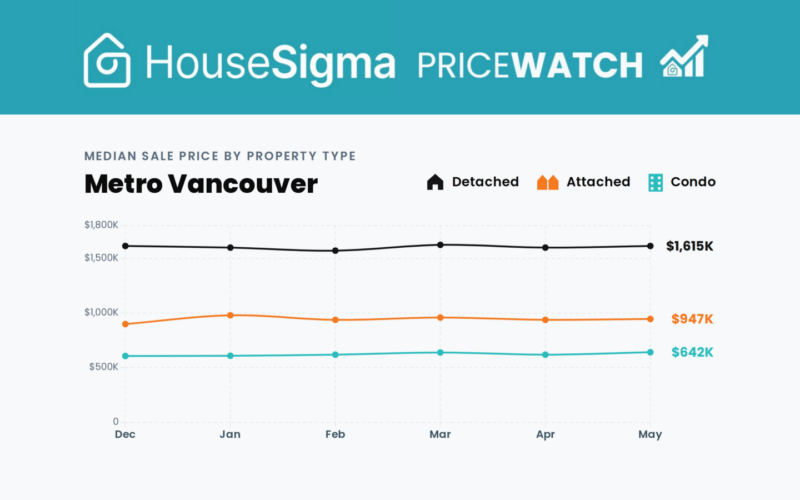
The Bank of Canada held its policy rate at 2.25% on June 10, the fifth straight decision to leave it unchanged and the level it
Read more