
Greater Toronto Area home sales slowed significantly in July, ending a run of spring and early-summer strength that had pointed toward a firmer second half of 2026.
HouseSigma recorded 5,514 total sales across the GTA’s 28 municipalities in July 2026, down 12.9% from June and 6.8% below July 2025 (see full infographic, below). July 2026 ranks among the weakest Julys in HouseSigma’s records, which run back to 2003.
Despite the slow sales, buyers had less to choose from than they did a year ago. Sellers pulled back even harder than buyers did, with fewer homes going on market in July, meaning a larger share of the homes that were available ended up selling.
Browse homes for sale near you Updated continuously from MLS feeds across Canada — filter for your price range and home specificationsHome sales by property type
Every property type lost transactional ground in July. Detached sales fell to 2,465, down 15.2% from June. Attached homes, which combine freehold townhouses, semi-detached, condo townhouses and link homes, came in at 1,543, down 10.2%. Condo apartments recorded 1,415 sales, down 12.5%. Some of the June-to-July gap is seasonal, given that activity typically eases as summer sets in.
It’s worth noting that detached properties account for roughly 45% of GTA transactions, so when that segment slows, the overall count inevitably follows.
The year-over-year picture is milder than the monthly one. July 2025 saw 5,919 total sales, so this July came in 6.8% lower. By home type, detached sales were down 3.8% year over year, attached sales were down 9.3% from a year ago, and condo sales dropped 9.9% over the year.
Median prices by home type
The overall median sale price was $870,000 in July, down 3.3% from June and 4.4% from July 2025. That figure is the lowest July median HouseSigma has recorded since 2020, when it sat at $810,000. Every July from 2021 through 2025 came in higher, peaking at $979,000 in 2023.
Detached homes sold for a median of $1,140,000 in July, down 3.5% from June and 5.0% from a year ago. Attached homes came in at $828,750, down 2.5% from the previous month and 4.7% over the year. Condo apartments held at $542,000, essentially flat against June at a 0.1% decline, and down 4.1% year over year.
Listing days on market
The typical active listing in the GTA had been on the market 34 days in July, up from 29 in June and 31 in July 2025.
Property days on market, which also counts time accumulated before a listing was delisted and quickly relisted, reached 62 days. That compares with 56 in June and 61 last July.
Both measures describe listings currently sitting on the market rather than how quickly sold homes found buyers. The July increase is the largest single-month move in either figure since January, and it reflects a market where the homes that remain available are taking longer to move.
New and active inventory
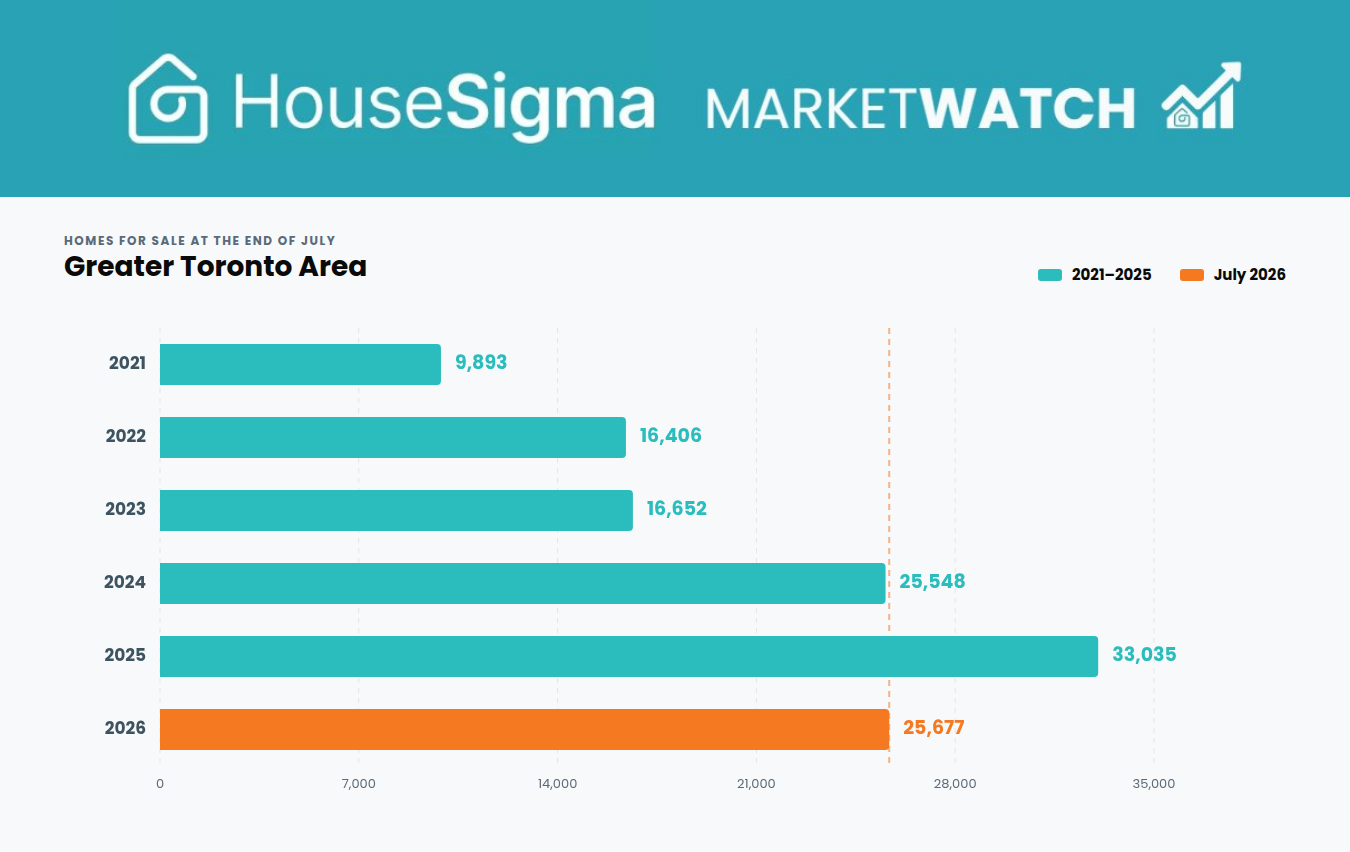
Active listings stood at 25,677 at the end of July, down 4.3% from June and 22.3% below July 2025. Inventory has now retreated to roughly where it sat in July 2024, erasing the build-up that defined last summer.
New listings fell further still. GTA sellers brought 14,387 homes to market in July, down 16.4% from June and 17.3% from a year earlier.
Put those together and the ratio of sales to available listings, which measures the proportion of homes on the market that actually sold that month, reached 21.5% in July. A year earlier it was 17.9%, and in July 2024 it was 21.2%.
So, while fewer homes sold this July than last, a larger share of what was for sale found a buyer. Listings moved off the market faster than they did a year ago. Demand didn’t surge; the pool of homes to choose from just shrank.
Buyer attention also shifted outward geographically. The five GTA municipalities drawing the most listing activity in July, measured by HouseSigma’s community popularity score, were Uxbridge, Aurora, King, Oakville and Whitby. The City of Toronto itself ranked ninth. The score tracks online engagement with listings rather than transaction volume, so smaller communities can rank highly on a modest pool of listings.
What it all means for buyers and sellers
Through the spring, the GTA’s real estate market numbers were pointing up. Sales climbed every month from February through May, from 3,672 to 6,517. The median price rose alongside them, reaching $920,000 in May, its highest point of the year.
July’s trends reverse those gains. Sales fell on both a monthly and annual basis, the median price reached a six-year July low, and listings sat longer. But supply fell too.
Buyers have less to choose from than they did a year ago, but they still have enough leverage to push median prices down across all three property types. Shrinking supply would normally firm prices up, but it has not done so yet.
How to spot your negotiating room on any home purchase The two data points on every HouseSigma listing that make it easyWhere that tension breaks is what will decide where prices go from here. If listings stay as scarce as they were in July, the downward pressure on prices should ease. If sellers return in volume in early fall, while buyers stay cautious, prices likely have further to drop.
Check out the full Greater Toronto July 2026 MarketWatch infographic below for more details and breakdowns by area and property type. Mouseover or touch the price chart points to reveal the full data.
See the latest real estate market trends Monthly stats updated for the Metro Vancouver market — filter for your community