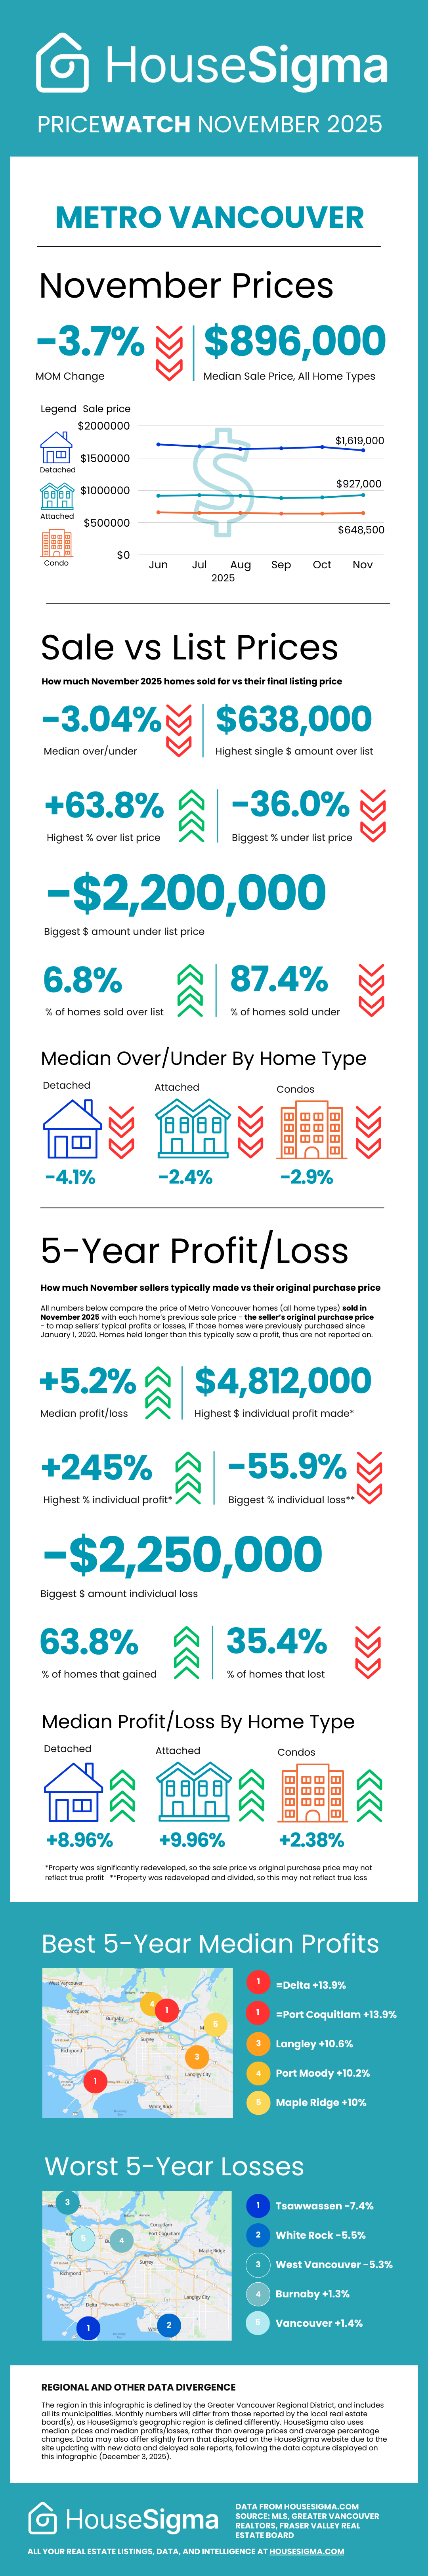
Nearly nine in 10 Metro Vancouver homes sold last month went for below list price, with a median drop of 3% under asking, a new HouseSigma infographic reveals.
HouseSigma’s new monthly infographic, PriceWatch, reveals how much above and below list price November homes sold for, including breaking it down by home type and which individual home sales saw the most over/under asking price.
One spectacular waterfront West Vancouver home sold $2.2 million under asking (ouch!), and another West Van oceanview property lost 36% off its list price.
At the other end of the extreme, one modest home in Vancouver’s South Main area sold for the most above asking price by both percentage and dollar amount – $638,000 more than the $1 million it was listed for.
The infographic also reveals how much November sellers in the region typically made, or lost, versus their original purchase price – the previous sale price. This data refers only to homes sold last month that were previously purchased since January 2020, as homes held for longer than this almost always saw a rise.
Karen Grunlund, HouseSigma’s managing broker for BC, commented, “With so many listings selling for below asking, now is the perfect time for homebuyers to grab a bargain ahead of the spring market.”
Check out the infographic below for all the details.
Find all your market trends data for Metro Vancouver here and keep up to date with our BC real estate blog here.