
By now, most of you watching the market will have read that sales in the Greater Toronto Area were up in June, compared with a year ago, while prices continued to decline. But why did that happen? The inventory behind the market is what tells the real story.
In June, a larger share of the homes on the market across the GTA sold than a year earlier, and yet the typical sale price kept drifting lower. That pairing says more about where the market is heading than the raw sales count on its own.
A bigger proportion of homes are selling
HouseSigma tracks the sales-to-active-listings ratio (see interactive infographic below), which is the share of active listings that sell in a given month. In June it came in at 23.6% across the GTA, up from 18% in June 2025. The ratio had dipped to 15.7% back in January before climbing through the spring and settling into the low twenties. In plain terms, sellers who had a home listed in June had a better chance of finding a buyer than they would have a year ago.
Browse homes for sale near you Updated continuously from MLS feeds across Canada — filter for your price range and home specificationsSales volume tells a similar story. HouseSigma recorded 6,334 GTA sales in June, up 3.1% from a year earlier and down 2.8% from May. Anyone comparing figures will see a higher number from TRREB, which reported roughly 6,770 sales and a 9.4% annual gain. The gap is a matter of scope: HouseSigma’s count covers the Greater Toronto Area shown on our Market Trends page, while TRREB’s board total now folds in several outer-Ontario markets recently added to its MLS system.
Prices kept easing, led by detached homes
Prices moved the other way, and the decline ran across all three home types. HouseSigma’s overall median sale price for the GTA was $899,900 in June, down 2.2% from May and 5.3% below June 2025.
The monthly slip was led by detached homes, where the median eased 4.0% to $1,181,000, leaving it 5.5% lower than a year ago. Attached homes were flat month over month at $850,000 but were down 4.5% from June 2025. Condo apartments edged down 0.9% to $542,800 from May, off 7.7% year over year, marking a continued decline in this segment.
Buyers still have plenty to choose from
The rising sales and declining prices can sit side by side because buyers are active without being cornered. There were 26,826 active listings at the end of June and another 17,211 added during the month. That’s enough supply that a buyer who walks away from one home still has plenty of others to consider. While terminated and expired listings rose month over month, they were still well below last June, down about 23% from a year earlier.
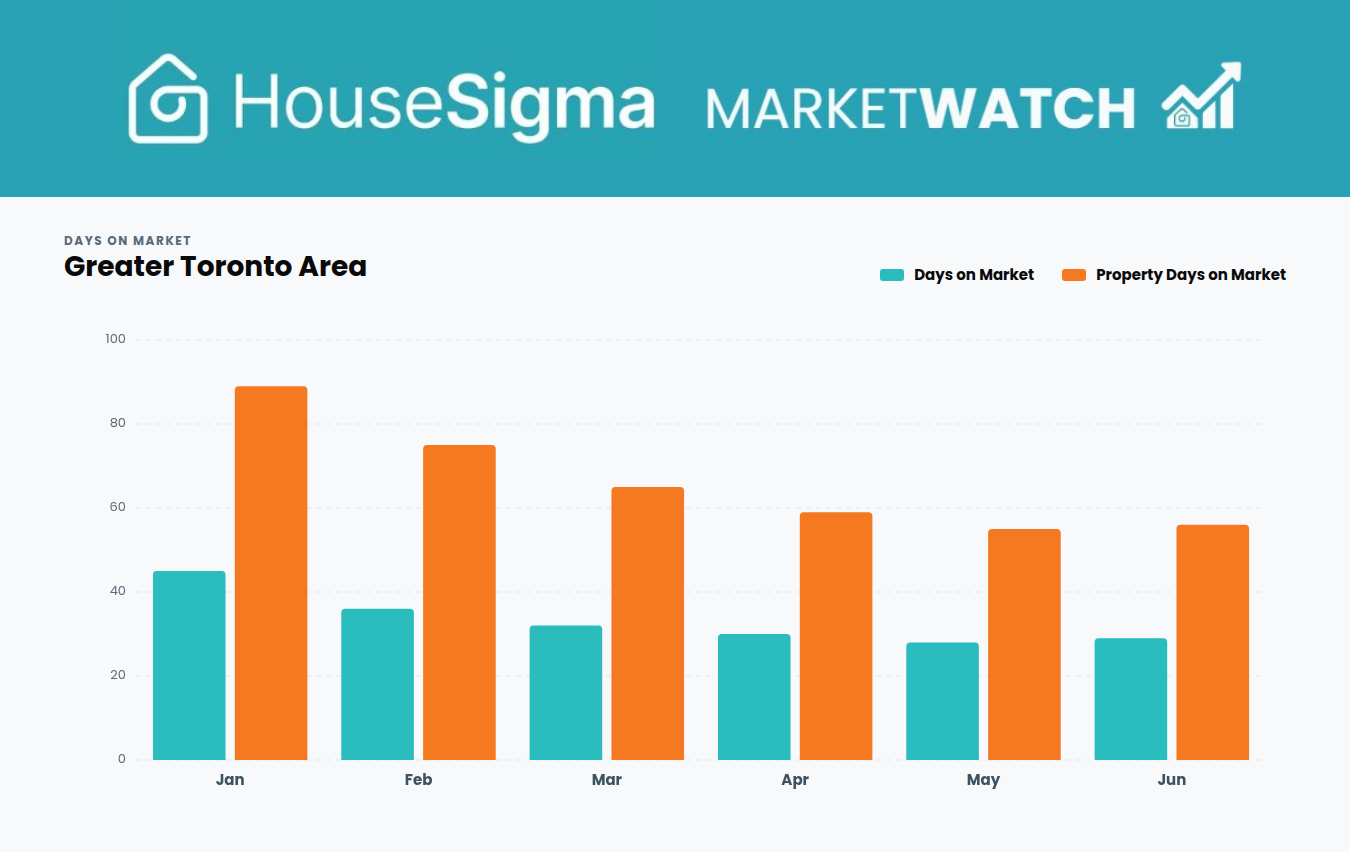
The average GTA home spent 29 days on market in June, and 56 days on average when accounting for homes that were taken down and quickly relisted.
Buyers are buying, but they are taking their time and negotiating as they go.
How to spot your negotiating room on any home purchase The two data points on every HouseSigma listing that make it easyWhat it means heading into the second half on 2026
For sellers, the practical takeaway is that closing a sale in this market comes down to pricing to it, not waiting for it. For buyers, the rising share of listings that sell is an early sign that today’s wide-open choice could narrow if new listings stay soft through the summer.
The share of homes selling has been the steadier growth signal this year than the month-to-month adjustments in price. Historically, HouseSigma data has found that the sales-to-active listings index is often a precursor to price changes. This could be the number to keep an eye on as the second half of 2026 gets going.
Check out the full Greater Toronto June 2026 MarketWatch infographic below for more details and breakdowns by area and property type. Mouseover or touch the price chart points to reveal the full data.
See the latest real estate market trends Monthly stats updated for the Metro Vancouver market — filter for your community