
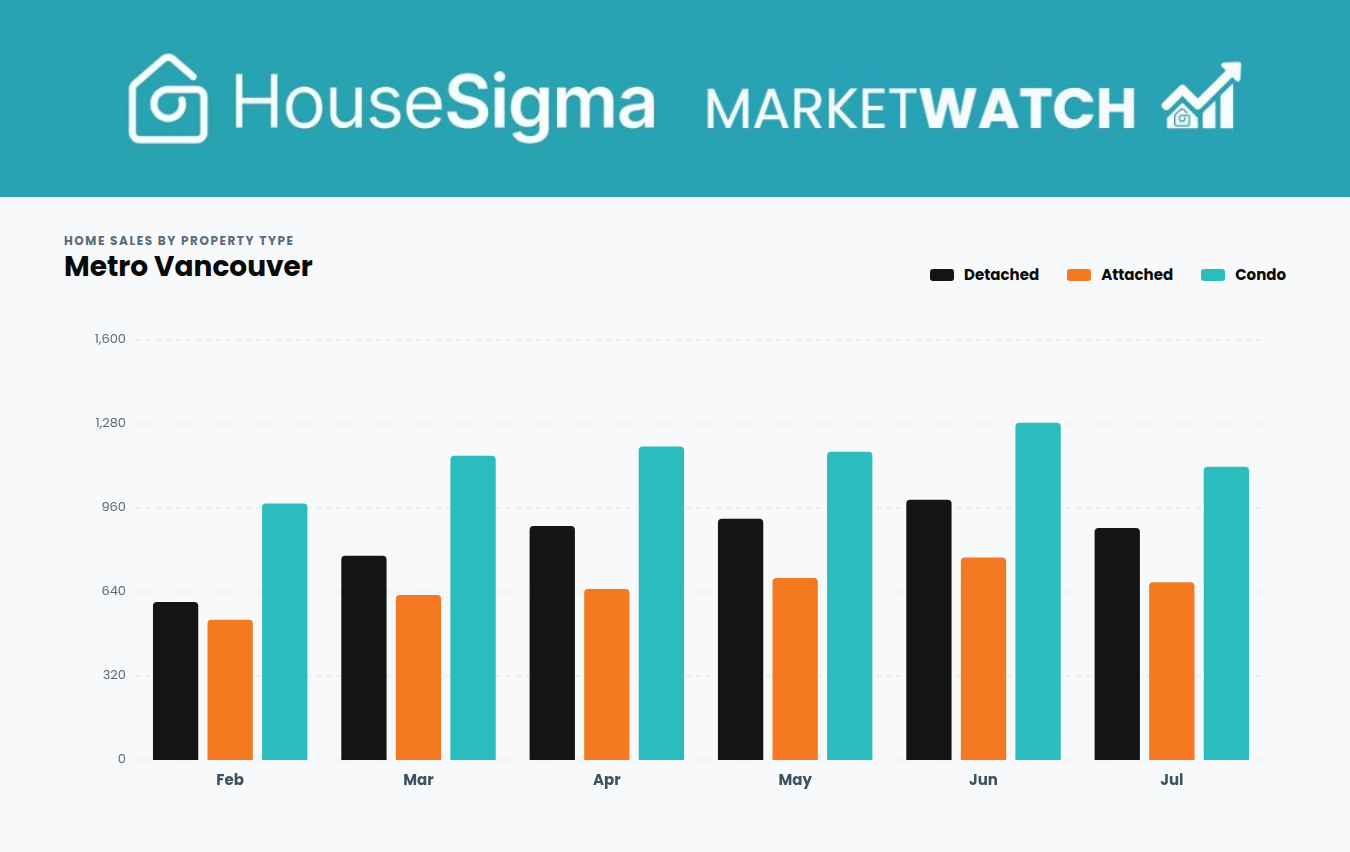
If you’re seeing headlines about Metro Vancouver home sales being down in July, it’s worth noting that, while this is true, it really depends on the home type you’re looking at.
New data from HouseSigma shows that Metro Vancouver recorded 2,698 home sales in July 2026, down 9.2% from the 2,973 sales registered in July 2025 and down 11.8% from June. However, condos accounted for the bulk of the decline, while detached sales held roughly level with last year, and attached home sales dropped to a lesser extent.
Home sales in July by property type
The three home types went in noticeably different directions year over year, in terms of July transactions.
Detached homes recorded 884 sales, which is up marginally from 880 in July 2025. Attached homes — such as townhouses, half-duplexes, and row houses — recorded 677 sales, down 3.7% year over year. Condos came in at 1,117 sales, down a significant 18.9% from a year earlier.
Comparing sales month over month, the picture looks quite different. All three types fell at a broadly similar rate: detached down 10.8% versus June, attached down 12.2%, and condos down 13.1%.
The divergence only appears in the annual comparison, and that distinction helps us to understand what’s truly happening. A broad month-over-month decline across all three types is what a normal July looks like due to the summer slowdown, whereas a 19% annual drop in one home type while another holds flat is not seasonal.
Browse homes for sale near you Updated continuously from MLS feeds across Canada — filter for your region and communityMedian prices by property type
The overall median sale price across Metro Vancouver was $909,000 in July, down 3.3% from June and essentially flat against July 2025, when it was $910,000. That stability is misleading, because every individual property type fell year over year.
Detached homes had a median sale price of $1,570,000, down 4.3% from June and 6.5% from July 2025. That is the lowest monthly detached median since January 2023. Attached homes came in at $899,900, down 4.3% from June and 6.7% year over year. Condos sold at a median of $600,000, down 3.2% from June and 7.7% from a year ago.
The reason the overall median price looks steadier is because condos are the region’s least expensive property type, and they made up a smaller share of July’s sales than they did a year ago. Fewer condo transactions and more detached sales in the mix pulls the region-wide median up, offsetting some of the decline within each individual type.
Listing days on markets and terminations
Time to sell increased slightly in July. Active listings in Metro Vancouver as of the end of July had been on the market an average of 41 days, up from 38 days in June and 36 days in July 2025. Property days on market, which also counts earlier time on market for homes that have been delisted and quickly relisted, averaged 74 days. That compares with 73 days in June and 68 days in July 2025.
Across the three property types, Metro Vancouver sellers withdrew 4,775 listings from the market, either terminating them or letting them expire.
Detached accounted for 1,681 of those, down slightly from June. Attached accounted for 1,084, down 3.0%. Condo apartments accounted for 2,010, up 4.3% from June — the only property type where terminations/expirations increased.
What it all means for buyers and sellers
Four separate measures show that condos are the weakest segment: year-over-year sales, market share, median price decline, and terminations/expirations.
For buyers, with condo listings taking longer to sell and a growing number being pulled from the market, this offers both opportunity to negotiate and plenty of options. But if you’re in the market for a detached home, you’ll have more competition, even if you can still get it for a lower price than a year ago.
How to spot your negotiating room on any home purchase The two data points on every HouseSigma listing that make it easyFor all sellers, but particularly condo sellers, July’s figures suggest that pricing to the market matters more than it did a year ago.
Check out the full Metro Vancouver July 2026 MarketWatch infographic below for more details and breakdowns by area and property type. Mouseover or touch the price chart points to reveal the full data.
See the latest real estate market trends Monthly stats updated for the Metro Vancouver market — filter for your community