
Metro Vancouver’s median home price in July 2026 was $910,000. That is the same figure the region recorded in July 2025, giving a year-over-year change of exactly zero, which could be seen as a flat market.
However, looking at the three property types separately, the picture changes completely. Detached homes, attached homes, and condos all fell between 6% and 8% over the year, and each is now at or near its lowest monthly median price in several years.
Median sale prices
The overall median price in Metro Vancouver was down 3.19% from June’s $940,000, on 2,697 sales across the region, and stayed flat year over year at $910,000.
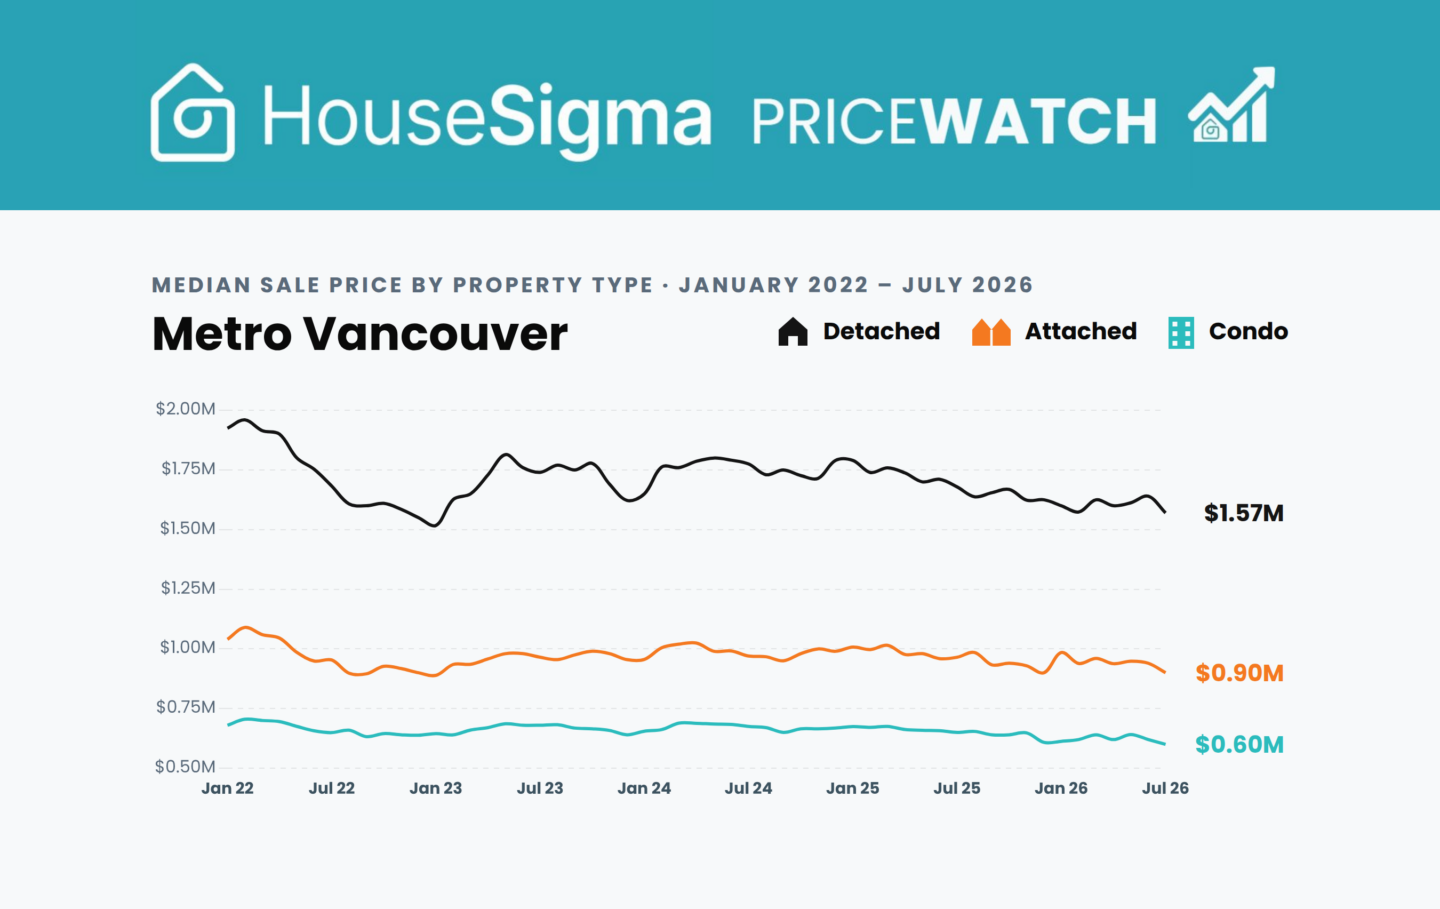
Detached homes had a median sale price of $1,570,000, down 4.27% from $1,640,000 in June and down 6.49% from $1,679,000 in July 2025. That is the lowest since January 2023.
Attached homes came in at $899,900, down 4.26% from $939,950 in June and down 6.75% from $965,000 a year ago, back to levels last seen in early 2023.
Metro Vancouver condos had a median sale price in July of $600,000, down 3.23% from $620,000 in June and down 7.69% from $650,000 a year ago. The condo median price has not been this low since August 2021. It also happens to be the exact figure recorded in March and April of 2021, before a run-up that peaked at $705,000 in February 2022, and has been declining ever since (see main image above).
Browse homes for sale near you Updated continuously from MLS feeds across Canada — filter for your region and communityDespite these annual declines, the region’s overall median price held year over year because of a change in what sold. Condos accounted for 41.7% of July sales, down from 46.6% a year earlier, while more expensive detached homes rose to 33% of sales from 29.7%. When more detached homes make up the month’s transactions, the all-types median is pulled upward, even if every individual home type declines.
Sale prices vs listing prices
Most July sellers in Metro Vancouver accepted less than they were asking. Across the region, 85.31% of sales closed below the asking price, 6.51% closed above it, and 8.18% landed exactly on it.
The median sale closed 2.95% below its final list price, a gap of $25,000.
The gap varied by property type:
- Detached homes sold at a median of 3.84% below their final asking price;
- Attached homes sold at 2.35% below; and
- Condo apartments at 2.86% below.
Market outliers
Three July home sales sat at the edges of the market in terms of sale-to-list price.
The largest percentage gain over asking went to an eight-bedroom Vancouver detached home built in 1910. Listed at $1,099,900, it sold for $1,350,000, or 22.74% above asking. The largest dollar gain was a Burnaby detached home built in 1966. It was listed at $2,600,000, and sold for $3,000,005, exceeding the asking price by $400,005.
A West Vancouver home with seven bedrooms across 9,902 square feet and built in 1992, was listed at $10,980,000 and sold for $8,180,000. The discount of $2,800,000 was the largest dollar reduction of any house sold in the region in July, and at 25.50% below asking it was also the largest percentage discount.
What it all means for buyers and sellers
For buyers, the flat regional median understates what has happened to prices over the past year, and the type of home being purchased matters more than the regional figure suggests. A condo buyer is looking at a median $50,000 below last July, and a detached buyer at one $109,000 lower. Given falling prices and large proportions of homes going under asking, that gives most buyers room to negotiate.
How to spot your negotiating room on any home purchase The two data points on every HouseSigma listing that make it easyFor sellers, the July pattern is consistent across the region. With 85.31% of sales closing below asking, and prices dropping in every category, sellers should set an asking price from the most recent comparable sales they can find. Anything from the spring reflects a higher market than the one they are listing into, and will point too high.
Check out the full Metro Vancouver July 2026 PriceWatch infographic below for more details and breakdowns by area and property type. Mouseover or touch the price chart points to reveal the full data.
See the latest real estate market trends Monthly stats updated for the Metro Vancouver market — filter for your community