Real estate is notorious for having price changes lag sales patterns, and this was evidenced once more in June’s sale and price figures for Metro Vancouver.
More homes sold across Metro Vancouver in June than in the same month a year ago, yet the typical sale price came in a little lower. HouseSigma recorded 3,059 residential sales for the month (see infographic below), up 5.8% from June 2025 and 9% from May. Over the same stretch, the overall median sale price settled at $940,000, down 1.1% year-over-year and 0.8% from May. Buyers were busier, but the extra activity didn’t push prices up.
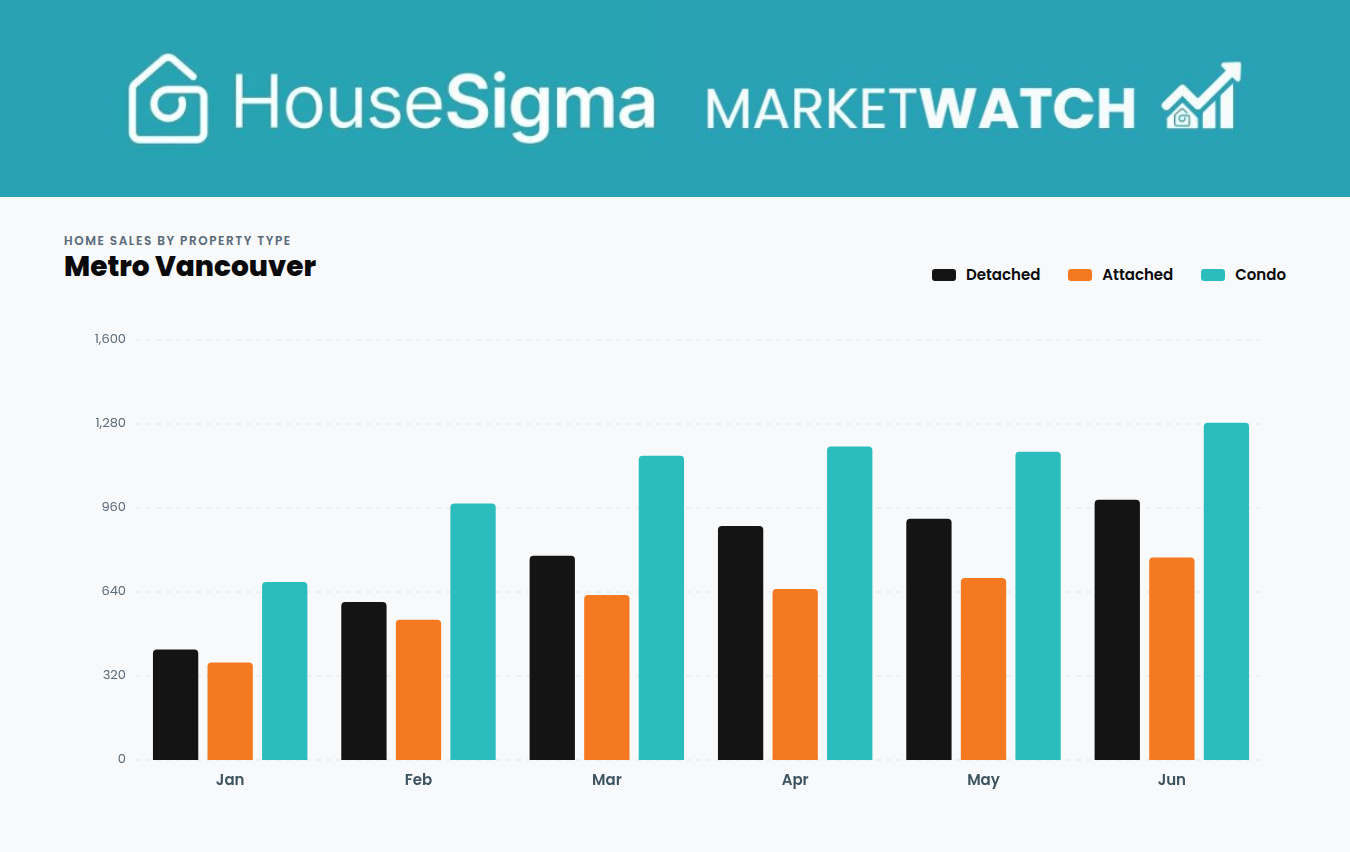
Of June’s 3,059 sales, condos made up the biggest group at 1,285 sales, ahead of 991 detached homes and 771 attached homes.
Browse homes for sale near you Updated continuously from MLS feeds across Canada — filter for your region and communityThe increased activity doesn’t mean the region turned into a scramble for every listing. In fact, homes sat an average of 73 property days on market (which includes when homes were delisted and quickly relisted), which is slightly higher than the previous month. So buyers generally had time to look, compare, and write offers with conditions rather than rushing.
A tale of three home types
The overall median price of $940,000, and its minimal year-over-year drop masks three different stories by home type.
Detached homes had a median of $1,640,000, down 4.1% from June 2025 but up 1.5% from May. Attached homes came in at $940,000, off 2.0% year-over-year. Condo apartments sat at $620,000, down 5.6% from a year ago and 3.3% from May, the largest year-over-year drop of the three types.
So while detached prices firmed up on a monthly basis, condos kept easing. The overall median drifted down slightly, but all home types fell more than the overall on an annual basis. This is due to the increased proportion of detached home sales versus the mix one year ago, keeping the overall median steady.
Why more sales didn’t lift prices
The supply side explains most of the sales vs price gap. Active listings at the end of June stood at 22,005, essentially level with a year ago (up 0.2%). New listings, at 7,958, were down 8.9% from June 2025. Fewer fresh homes came to market this June, but because the existing pool of available homes held steady, buyers still had plenty to work with.
Put the two figures side by side and the balance shows 3,059 sales against 22,005 active listings works out to roughly one in seven available homes selling during the month. That’s a market where more buyers can transact without having to outbid each other for scarce inventory, which is consistent with prices weakening or staying flat, rather than climbing.
What it means if you’re buying or selling this summer
For buyers, the mix of steady inventory and a moderate pace means there’s room to be selective. With listings averaging over five weeks on the market, an offer with normal conditions is far more workable than it was during the frenzied stretches of a few years ago.
How to spot your negotiating room on any home purchase The two data points on every HouseSigma listing that make it easyFor sellers, the same numbers argue for pricing against recent comparable sales rather than last year’s hopes. Homes that are priced to the current market are the ones moving, while those that aren’t tend to sit.
Where prices go from here will depend on how the next Bank of Canada decision lands and how much new inventory arrives once the fall listing season begins.
Check out the full Metro Vancouver June 2026 MarketWatch infographic below for more details and breakdowns by area and property type. Mouseover or touch the price chart points to reveal the full data.
See the latest real estate market trends Monthly stats updated for the Metro Vancouver market — filter for your community