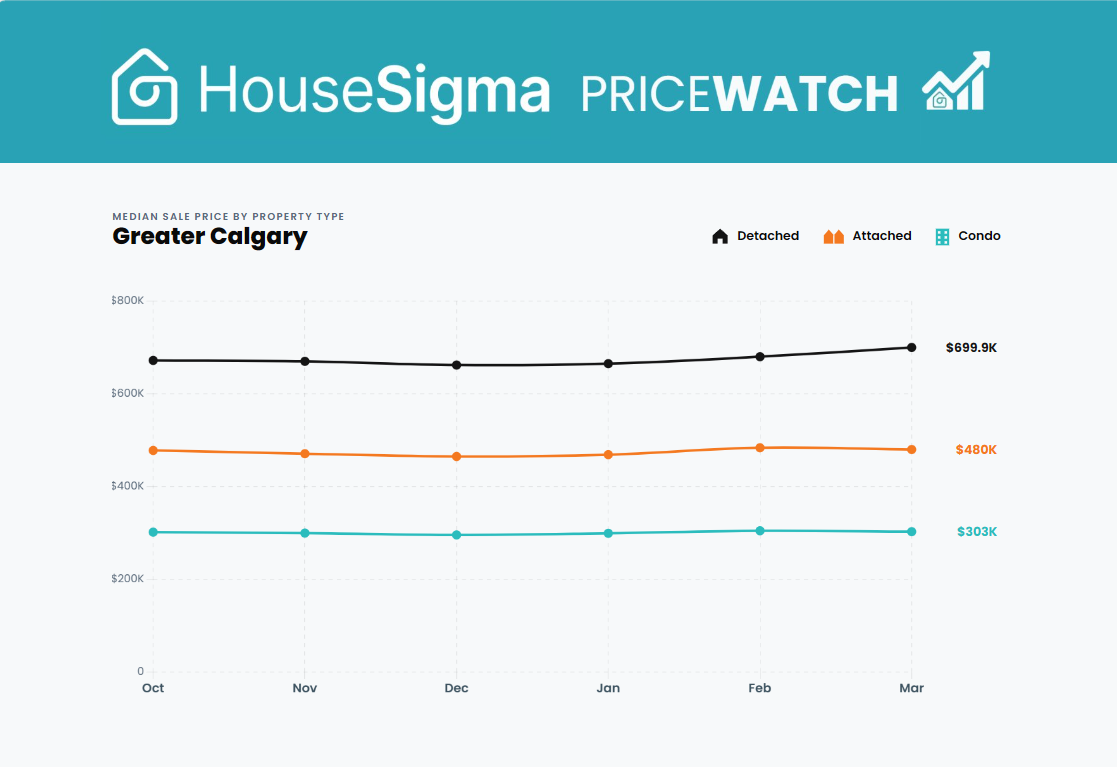
Greater Calgary’s real estate market picked up in March — at least compared with February. Sales rose to 2,304, which was up 23% from the previous month, and the overall median sale price climbed to $582,500, a 2.2% month-over-month gain. Detached homes led the recovery, with the median price reaching $699,900 after bottoming out at $662,000 in December.
But when you compare the market with a year ago, today’s picture looks very different. Every property type in Calgary saw a median March price below that of a year ago, and the overall median price was down 1.4% year over year. Detached homes, despite recent months of gains, are still down 4.0% from March 2025, when the median was $729,200. Attached homes sit at $480,000 — 3.8% below the $499,000 recorded a year earlier. Condos have fallen the furthest: at $303,000, they’re 6.9% below March 2025’s $325,500.
The overall median decline of −1.4% is softer than it looks because the total mix shifted slightly toward detached sales this March (53% of sales vs 49% a year ago), which boosts the headline number.
What all this means is that the spring price uptick is real — but it’s merely recovering some of the ground lost over the past year, and is very far from breaking new territory.
What sellers are closing for
Sellers are feeling this gap. In March, 78.4% of Calgary homes sold under their asking price, with the typical home closing 1.88% below list — about $9,900 on a $582,500 median price. Only 13.7% of sales went over asking.
However, that discount has been narrowing since December, when it peaked at 2.56% below list. January came in at 2.31% and February at 2.06%, so with March at 1.88%, that’s the smallest price gap in six months. But a year ago, in March 2025, the typical home sold at just 1.25% under asking. So while the direction is improving for sellers, buyers are still negotiating a larger discount than they were this time last year.
The gap varies by home type. Detached buyers negotiated the most modest reductions, with the median sale landing 1.64% below list. Attached homes came in at 1.84% under. Condos saw the largest discount, closing at a median of 2.66% below list — consistent with the steeper year-over-year price decline in that segment.
Best and worst sale prices vs list
The Greater Calgary home that sold for the highest dollar amount over asking was a lovely detached home in Elbow Park that sold for $266K more than its $1.499M asking price, fetching $1,715M. By percentage, the biggest list-to-sale-price gain was this 1961 modernist-style renovated home in Charleswood, which sold for 22% above asking, at $1.2M.
At the other end of the outlier scale, the largest dollar drop from list to sale price in March was borne by this luxury Upper Mount Royal house, which sold for $349K less than its $3.499M list price. And by percentage, it was this older home on a corner lot in Highland Park, which is ripe for redevelopment. The sellers wanted $999K, but got $818K, a drop of 18.2%.
What to make of the stats
Despite such outliers, the detached market is relatively stable and balanced. But for those looking to buy or sell a condo, this segment of the market is worth watching. The combination of the steepest year-over-year price drop and the largest discount to list suggests supply in that segment is outpacing demand more than in either detached or attached categories. For buyers, that means more room to negotiate. For sellers, it means pricing conservatively matters more in condos than elsewhere.
Sellers are feeling a bit more confident compared to the start of the year, we’re seeing more activity, more showings, and some momentum coming back into the market. But at the same time, pricing is still very sensitive. Buyers are informed and cautious, and they’re not chasing the market the way they were before.
Raj Sandhu, leading HouseSigma agent in Calgary
What we’re seeing right now is more of a recovery phase than a true surge. Properties that are priced well and show well are moving, but anything even slightly off is sitting longer or getting negotiated down.
Check out our interactive March 2026 Calgary PriceWatch infographic, below, to see the full stats breakdown by property type and community. Just hover over or click on the graph to see the precise data.
Find Calgary-region homes for sale on our Map Search page, where you can filter for price, property type, and much more. Plus, keep your eye on our Alberta blog page to stay up to date with market trends, sales data, and remarkable listing stories.