Edmonton’s median sale price in March was $435,000 — almost exactly where it was a year ago. If you stopped there, you’d call it a stable market and move on. But look at how those sales are actually closing, and a different picture emerges.
A year ago, one in three Greater Edmonton buyers paid over the asking price. In March 2026, that figure has dropped to one in five. At the same time, the share of homes selling below list has jumped from 55% to 70.5% in a year. The typical home is now selling about 1.6% under its list price, compared with 0.6% under list in March 2025.
Prices haven’t collapsed, but the negotiating dynamic has shifted materially in buyers’ favour, and this shift hasn’t shown up in the headline median price number yet.
At the same time, fewer people are buying homes. March saw 2,220 sales across Greater Edmonton, down 14% from 2,533 in the same month last year. That kind of volume contraction, combined with widening gaps between list and sale prices, seems to reflect a market where sellers are holding their price expectations while buyers are pulling back. The result is a headline median price that looks like equilibrium but is arguably more fragile.
Median prices by property type
The property type picture is broadly consistent across the market. Detached homes — the largest segment at over 1,300 March sales — came in at $515,000, down about 1% from a year ago. Attached homes edged down similarly, from $360,000 to $357,000. Condo apartments were the one segment to tick upward, finishing at $200,000 region-wide versus $195,500 last March.
None of these are dramatic moves, but they all point in the same direction: modest price softening across the board, with buyers consistently finding room to negotiate regardless of property type.
Regional variations
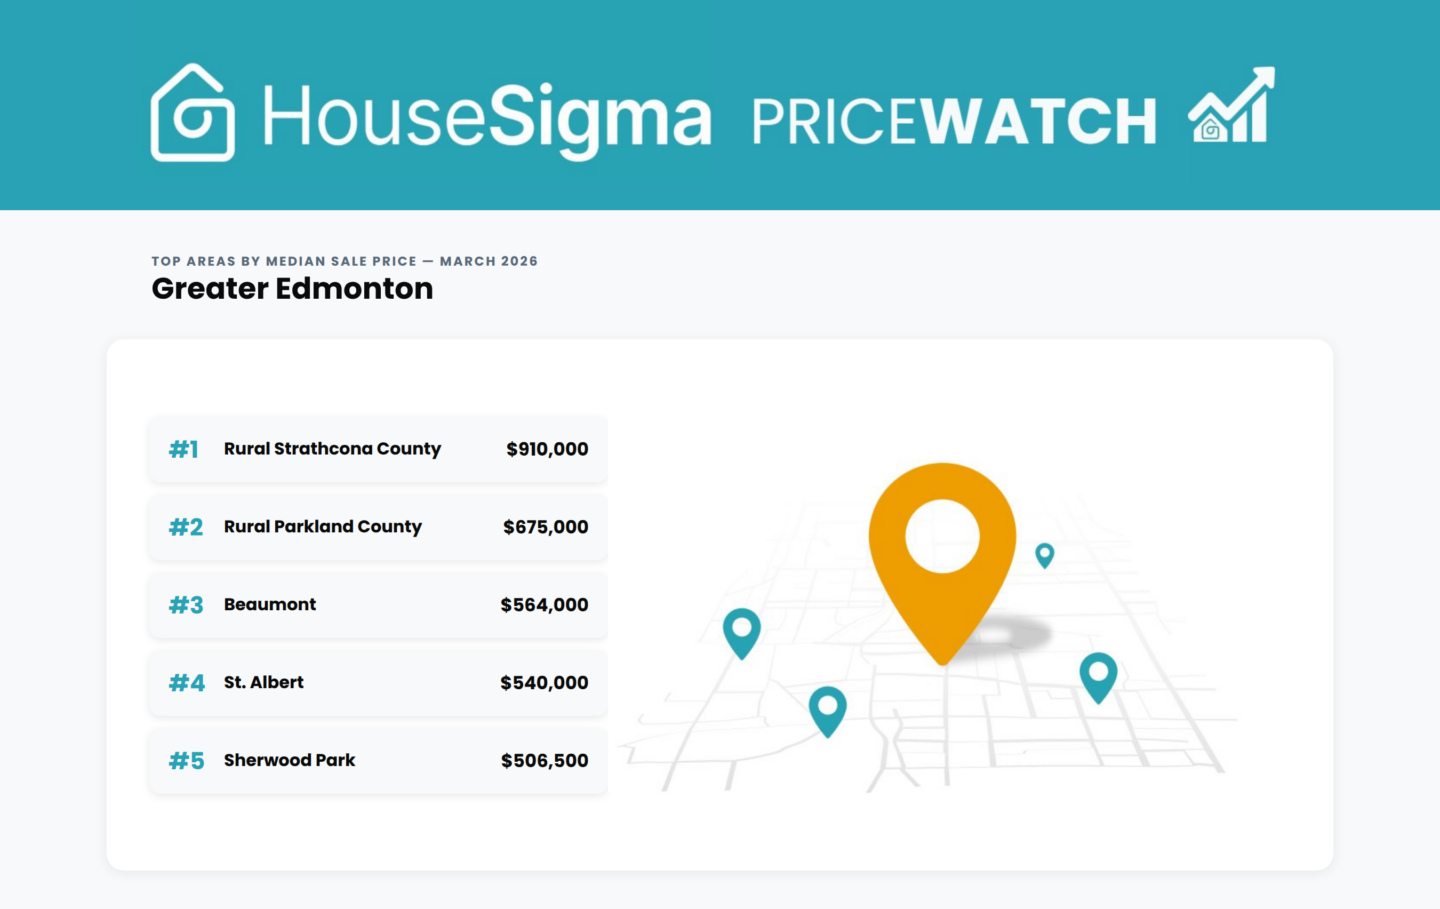
Not every part of the region is moving in lockstep, though. St. Albert posted a $540,000 median price in March, up nearly 7% year-over-year, and Beaumont reached $564,000, up close to 11%. Sherwood Park held essentially flat. Meanwhile Fort Saskatchewan and Spruce Grove both pulled back around 5% from where they were a year ago.
These divergences don’t follow a simple pattern of inner versus outer ring — they reflect local supply and demand conditions playing out differently across communities that are all nominally part of the same market.
Extremes in list vs sale price
The Greater Edmonton home that sold last month for the most above its list price, in both dollar and percentage terms, was this brand-new Fort Saskatchewan townhouse. It’s in the new masterplanned community of Southpointe, and there are many other lots available through the developer. It sold for $539,649, which is a jaw-dropping 50.1% or $180K above the $359,649 sticker price, proving that even though this home appeared in our “What you can buy for $350K in Greater Edmonton” post, the market can sometimes throw a curveball.
Doing less well for the seller was this riverfront family home in Crestwood, which sold for $600K lower than its $3.5 million price tag. And by percentage, the steepest discount in the region last month was this already-low-priced condo-apartment in Oliver, which sold for 26.2% less than its $84.7K asking price, at a mere $62,500.
What all this means for buyers and sellers
For sellers, the stable headline median price provides reassurance, but it obscures the fact that list prices and sale prices are drifting further apart. The gap between what sellers are asking and what buyers are paying has quietly widened over the past year, and that trend is worth watching regardless of where the median sits.
For buyers, the March numbers offer something that hasn’t been consistently available in Edmonton for several years: genuine negotiating room across most of the market. With seven in ten homes selling below asking price and the typical sale closing nearly $6,000 under list, there’s a reasonable expectation of a discount built into most transactions right now. That leverage is most pronounced for condo buyers, where prices have drifted down about 2% from a year ago and sellers are routinely accepting offers well below asking. But even in the detached segment, the days of waiving conditions and bidding blind are largely behind us — at least for now. Buyers who are prepared, pre-approved, and willing to negotiate should find this market more forgiving than the headlines suggest.
Check out our interactive March 2026 Edmonton PriceWatch infographic, below, to see the full stats breakdown by property type and community. Just hover over or click on the graph to see the precise data.
Find Edmonton-region homes for sale on our Map Search page, where you can filter for price, property type, and much more. Plus, keep your eye on our Alberta blog page to stay up to date with market trends, sales data, and remarkable listing stories.