You may be familiar with the K-shape concept of an economy or market, where some elements are growing or stable, while other parts of the same market decline. Now, a new analysis of January 2026 data from HouseSigma has found this phenomenon is clearly showing up in two ways in the Calgary real estate market — in both property type and geography.
Property type: Year over year, City of Calgary median detached sales have barely dipped (-2.4%) and buyers are still competing for houses, whereas attached and condo sales numbers both fell by around 25% over 12 months. The upper arm of the K is shown by detached homes, still thriving, compared with the lower arm of attached homes and condos, dropping in sales volumes. Price declines tend to lag dropping sales volumes as inventory builds up, so we expect to see steeper price drops in condos and attached homes in the coming months, compared with detached homes.
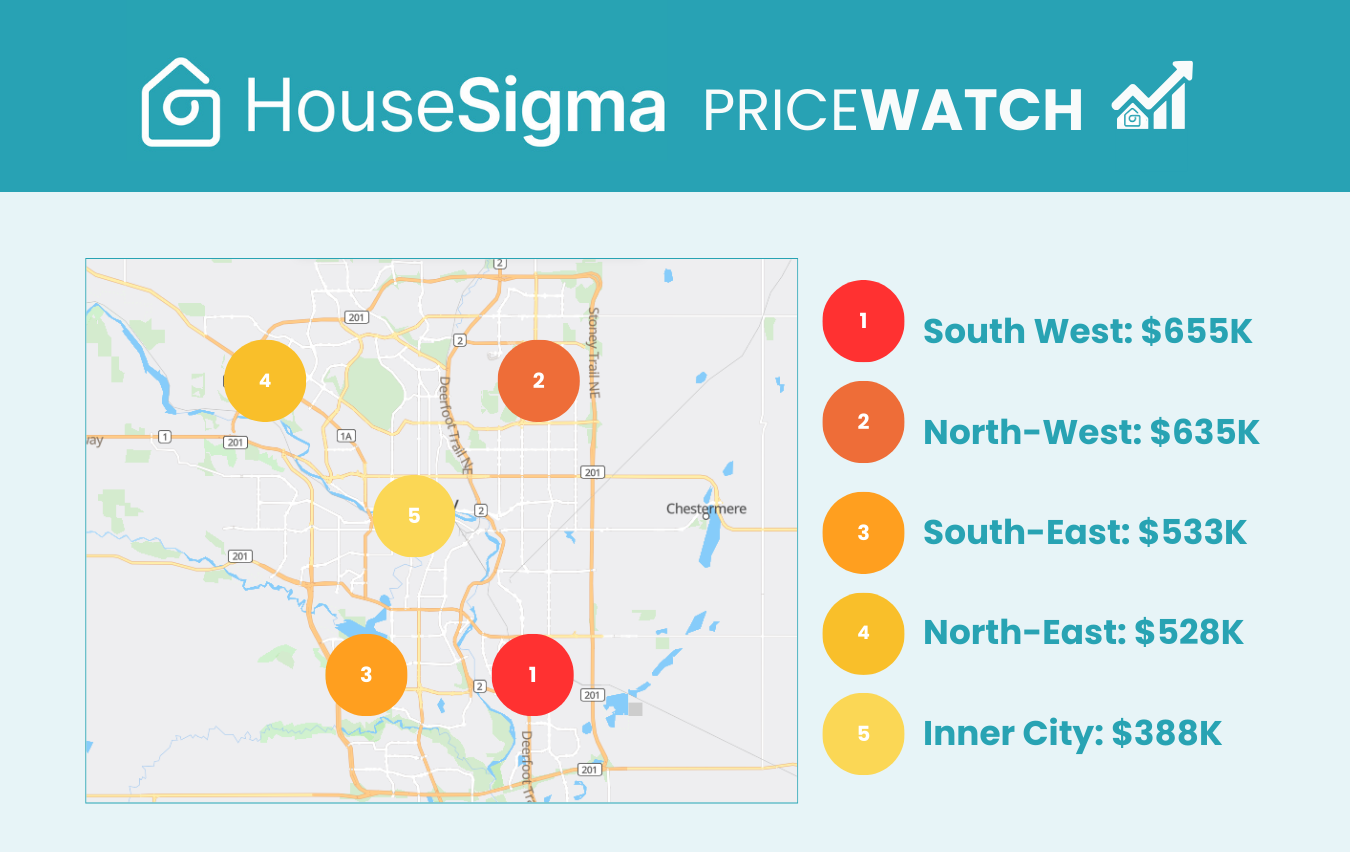
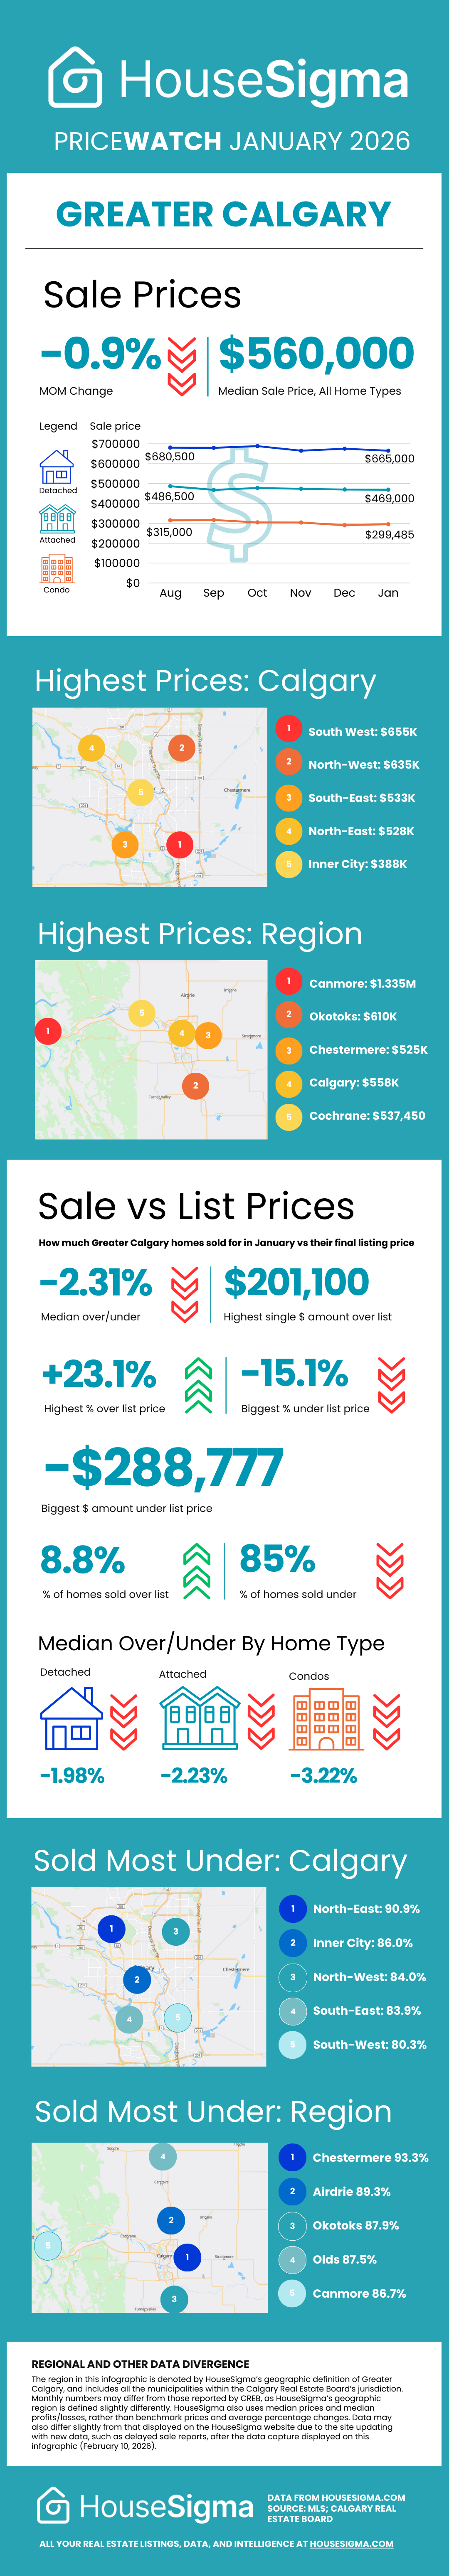
Geography by quadrants: Thriving parts of the city are the South-West (where median sale prices in January were up 7.2% year-over-year) and North-West (+2.4%), while the South-East (-5.8%), North-East (-2.3%) and condo-heavy city central core (-3.6%) flounder.
Where the two (home type + geography) intersect: The South-West quadrant is the most detached-heavy, higher-income part of the city, so it benefits on both the property type and the geography aspects. Calgary’s central core and North-East are where condo and affordable multi-family concentrate, so that’s pulling those areas down.
A tale of two market realities: All the above means today’s detached home buyer in South-West Calgary is living in a real estate market where prices are robust and competition for homes is still real. Whereas a condo buyer in the Inner City or North-East is living in a world where prices are down and inventory is piling up, giving the buyer the advantage in a struggling market. Same city, same month, two different realities.
CREB stats support this data: CREB’s January 2026 figures on sales volumes and prices mirror the above. They also show detached homes at just 2.67 months of supply (a seller’s market) versus condo-apartments at 5.26 months (balanced but leaning towards a buyer’s market), and North-East condo-apartments at nearly 13 months (deeply distressed). Not to mention there are 26,000 units under construction that will mostly hit the already-oversupplied condo segment. The K shape to this market doesn’t look like it will resolve any time soon.
Sale versus listing prices: When looking at how much Calgary buyers paid in January 2026 compared with the final listing price, the South-West is worth noting. Even though HouseSigma data shows its median discount is moderate at -2.11%, it has by far the highest share of over-asking sales at 14% and the lowest share of under-asking sales at 80.3% (see infographic below). That’s where the bidding wars are happening, which lines up with the South-West being the strongest quadrant on price growth.
The wider Greater Calgary region: Zooming out on the wider region and including other municipalities from Chestermere to Canmore, the K-shape shows up in the sales versus listing price analysis again. Detached homes across the region have the tightest gap — sellers are only giving up about 2% on average, and nearly 1 in 5 detached sales went at or above asking (18.4% combined). Condos are a different story entirely — the typical condo sold 3.2% below asking, and fewer than one in 12 went over asking (3.6%). Over 91% of condo sales closed below list price.
Raj Sandhu, a leading HouseSigma agent in Calgary, said, “Detached homes, especially in the SW, still have real competition and confidence behind them, while condos are sitting longer and buyers know they have leverage. Until supply balances out, that split is going to stay with us.”
Looking at the extreme individual outliers in sale versus listing price, the Greater Calgary home that sold in January for the most over asking price, by dollar amount, was this pretty bungalow in a highly sought-after Roxboro location. it went for $201,100 over its near $1.6 million price tag — we’re guessing this could have been a developer bidding war. By percentage, the highest gain was a 23% premium paid for this modern West Springs house with an unfinished renovation, which had been listed for $650,000 but sold at $800,000.
At the other end of the scale, the biggest price haircut was seen by this large Pump Hill house, which gave the buyer a $288,777 discount off its $2,888,777 asking price. That was not the largest percentage decline, which went to a modest bungalow in Parkhill that was clearly sold for its lot. It went for $760K, more than 23% off its $895K list price.
Check out the overall Greater Calgary January PriceWatch infographic below for more details on home prices and regional breakdowns.
Find Calgary-region homes for sale on our Map Search page, where you can filter for price, property type, and much more. Plus, keep your eye on our Alberta blog page to stay up to date with market trends, sales data, and remarkable listing stories.