Have you been waiting out the spring market before buying a home, in order to get a better deal? The latest monthly home price figures might give you some guidance.
New HouseSigma data (see infographic below) shows that in April 2026, 69.4% of Edmonton-area homes sold for less than their final list price. A year earlier, in April 2025, that figure was 57.3%. The 12 percentage-point gap shows how differently this spring is playing out from last spring for anyone shopping for a home in the Edmonton region — buyers this year have a lot more leverage.
The typical sale-vs-list-price difference has moved in the same direction. April 2025 saw a median discount of just −0.9% off list. April 2026 came in at −1.4%, with a median discount of roughly $5,000.
Neither figure suggests a market in retreat, but together they describe a spring where most buyers are paying less than the asking price rather than meeting or exceeding it.
The pattern is broad rather than concentrated. Detached homes closed at a typical −1.1% under list, attached at −1.6%, and condo apartments at −3.4%. Of the 2,846 residential sales we tracked in April, 1,974 closed under list, against 621 above and 251 at asking.
December saw the peak discount
However, what the year-over-year comparison misses on its own is that buyer position has been weakening through 2026 so far, not strengthening.
December 2025 was the peak: 85.0% of sales closed under list that month, the highest share in the 25 months of data we reviewed for this analysis. The typical December buyer paid 2.3% under asking. Each month since has chipped away at that share. January came in at 80.0%, February at 76.2%, March at 71.3%, and April at 69.4%. The typical discount has narrowed in step, from −2.3% off list in December to −1.4% in April.
Some of this is seasonal. Greater Edmonton’s spring market historically sees more competitive pricing as listings rise and buyer interest comes back. But the pace of the decline is steady with four consecutive monthly drops.
Communities where buyer room is deepest
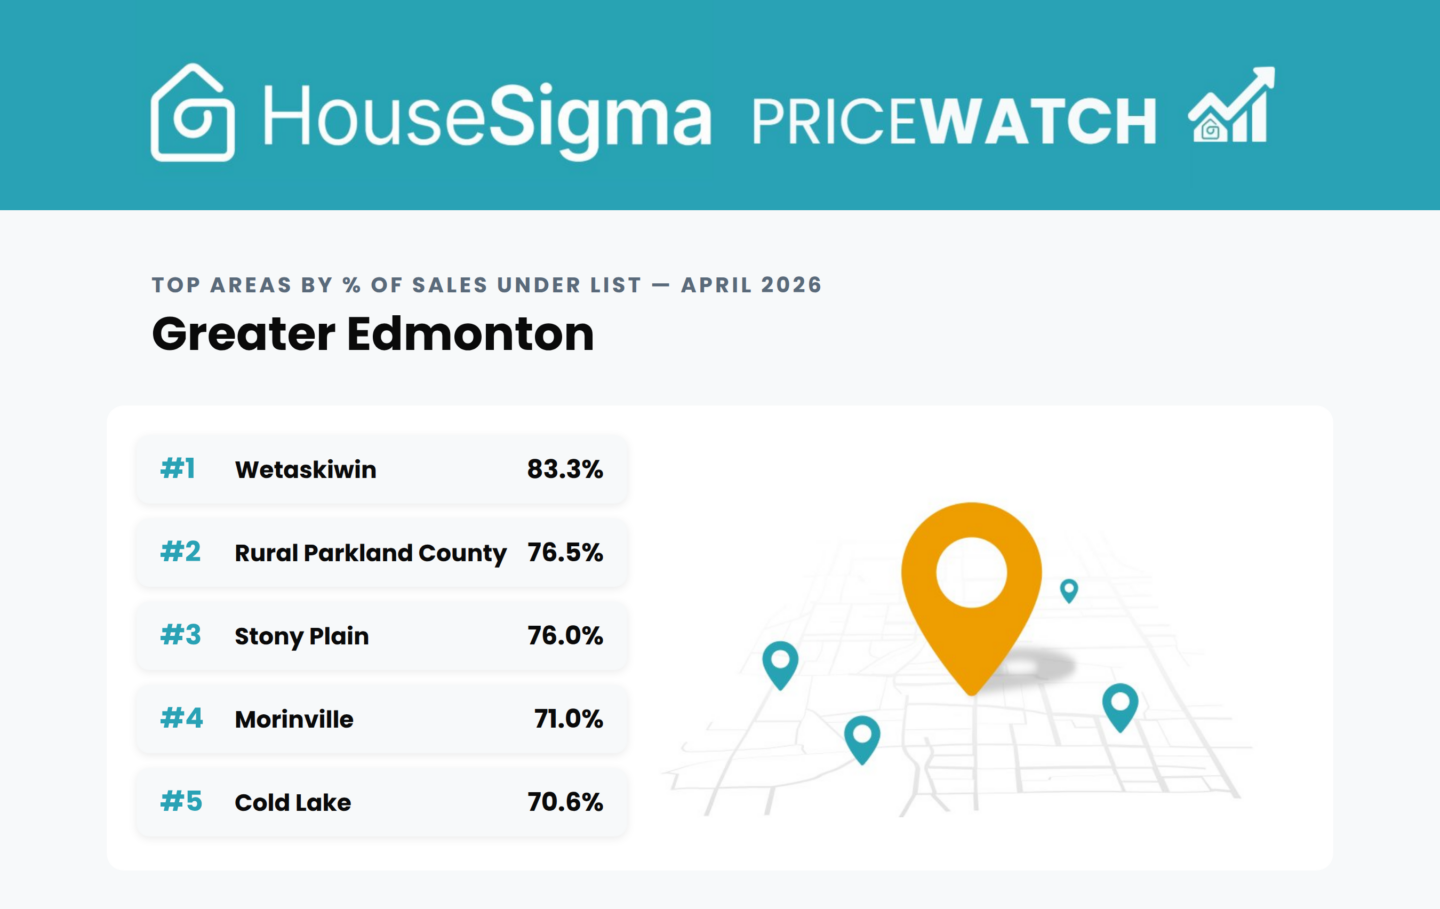
The data points to established Edmonton neighbourhoods. The Walker community saw 96.2% of April sales close under list, on 25 of 26 transactions. Meadows Area came in at 90.9%, Windermere Area at 90.2%, Downtown Edmonton at 89.3%, and McConachie Area at 87.0%. (Each met our research’s 20-sale minimum that filters out small-sample noise.) In the broader region, Wetaskiwin led at 83.3%, followed by Rural Parkland County at 76.5% and Stony Plain at 76.0%.
These are areas where the typical 2026 buyer goes in expecting to negotiate below list, and succeeds. The widespread under-list closings don’t signal distressed selling. They reflect realistic pricing meeting realistic offers.
Takeaways for buyers and sellers
For buyers, the read is straightforward. The window of widest negotiating room has likely passed, but the level still sits noticeably above where it was last spring. Those who are buying now can comfortably offer below list price in most instances, while knowing that now is a good time to strike.
For sellers, the implication runs the other way. The rapid-fire spring conditions of 2024 and 2025, when roughly four in 10 Edmonton homes closed at or above asking, have not returned. A sharp pricing strategy matters more than it did 12 months ago.
Check out our interactive March 2026 Edmonton PriceWatch infographic, below, to see the full stats breakdown by property type and community. Just hover over or click on the graph to see the precise data.
Find Edmonton-region homes for sale on our Map Search page, where you can filter for price, property type, and much more. Plus, keep your eye on our Alberta blog page to stay up to date with market trends, sales data, and remarkable listing stories.