
Buyers in Greater Edmonton were more likely to pay less than the asking price in August than a year ago, and the shift was largest inside the city itself.
New HouseSigma data shows that, within Edmonton’s city limits, 81.3% of homes sold for less than their list price, up from 74.7% in August 2025. In the towns and smaller cities around Edmonton, 69.6% sold under list, compared with 64.9% a year earlier.
Across the region, the median home sale price in August was $425,000, virtually unchanged from a year ago (only $50 higher) and 2.3% lower than in July.
Browse homes for sale near you Updated continuously from MLS feeds across Canada — filter for your price range and home specificationsSale vs. list prices
The typical Greater Edmonton home sold 1.9% below its asking price in August (see infographic below), a gap of $7,275. Just over three in four sales (77.1%) sold under list, up from 71.5% in August 2025, while 15.0% went over and 7.9% sold at asking.
By property type, detached homes sold at a median of 1.6% under list, attached homes 1.8% under and condo apartments 3.4% under.
Because Edmonton proper has a bigger share of condos than surrounding communities, which increases the area’s likelihood of selling under list price, we also compared detached houses on their own. The city still had the higher share of detached homes selling under asking, at 77.5% compared with 69.2% outside the city. The increase from last August was about the same in both the city and its surrounding regions, at roughly six percentage points.
Region-wide, including the city, the share of homes selling under asking has now risen four months in a row: 69.4% in April, 70.7% in May, 73.1% in June, 75.2% in July and 77.1% in August.
How to spot your negotiating room on any home purchase The two data points on every HouseSigma listing that make it easyMedian prices by home type
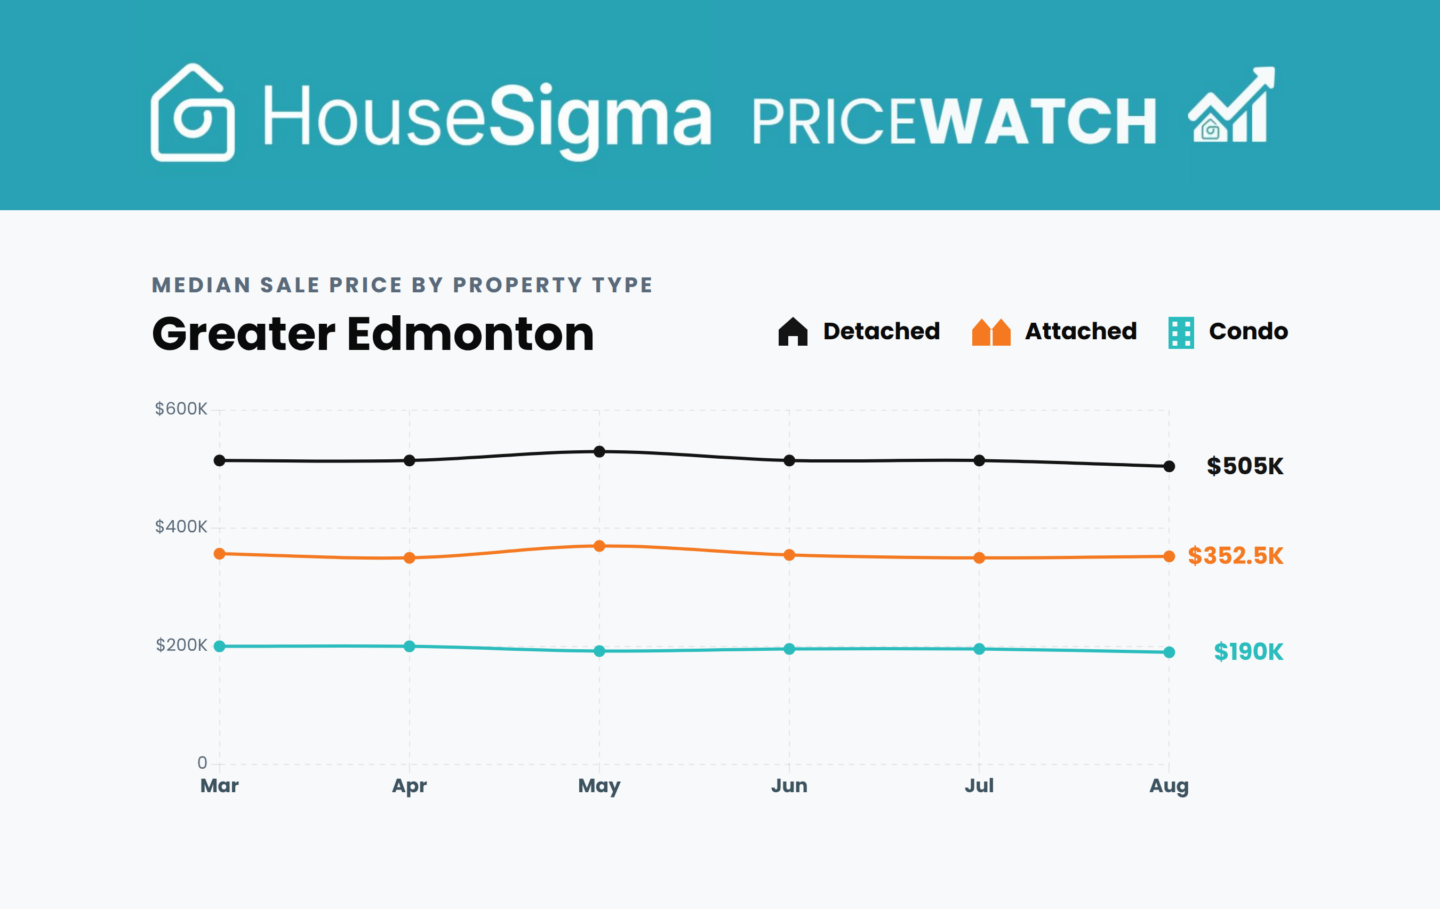
Detached homes sold for a median of $505,000, down from $515,000 in July and the lowest detached figure in the six months covered by this month’s PriceWatch chart (March to August, see below). It is still about 1% above August 2025’s $500,100.
The condo apartment median sale price slipped to $190,000 from $195,500 in July, also a six-month low, and 5% below August 2025’s $200,000.
Attached homes moved the other way. Their median August sale price edged up to $352,500 from $349,900 in July, and was about 2% above August 2025’s $345,000, though it remains below May’s $370,000.
Market outliers: sale vs. list price
All four of August’s outlier sales, in terms of the gap between asking price and final sale price, were detached homes, and two sat on rural acreages.
The sale furthest above asking in percentage terms was a run-down, boarded-up house on 3.08 acres in Parkland County. This development opportunity was listed on August 6 at $260,000, and sold 13 days later for $395,000, or 51.9% over list.
The biggest dollar premium came inside the city. A handsome five-bedroom, two-storey family home in Laurier Heights was listed at $1,249,000 on August 13 and sold two days later for $1,462,500, which is $213,500 over asking.
A tiny, 1993-built, two-bedroom bungalow in Cold Lake had the deepest percentage discount of the month, selling for $74,999 against an asking price of $109,900, or 31.8% under list.
The largest dollar discount went to an ornate and outdated five-bedroom home sitting on just over two acres with mature landscaping in Strathcona County. Asking $1,250,000, it sold on August 11 for $925,000, which is $325,000 (26%) below list.
What it all means for buyers and sellers
For buyers, an offer below the asking price is in line with how most Greater Edmonton homes sold in August, particularly in the city. The typical discount was modest, though, so it makes sense to check recent sale-to-list results for the specific neighbourhood and home type before settling on a number. Buyers in rural areas may also want to act quickly, as some rural acreages in August sold well above asking just days after listing.
Sellers should expect to land slightly below their asking price, given that most homes did in August. Pricing from recent sales of similar nearby homes gives a more realistic starting point than competing asking prices. Sellers should also note that buyers also have more choice, with 8,945 active listings as of the end of August, up from 7,845 a year earlier.
Check out the full Edmonton August 2026 PriceWatch infographic below for more details and breakdowns by area and property type. Mouseover or touch the price chart points to reveal the full data.
See the latest real estate market trends Monthly stats updated for the Greater Edmonton market — filter for your individual community