Home sales in Metro Vancouver jumped 22% from February to March. If you stopped reading there, you might think the spring market was off to a strong start.
However, the seasonal bounce from February to March is one of the most predictable patterns in real estate, and March 2026 followed that script. When you pull back from the month-over-month headline, this March is still a very slow month by almost any other measure.
March’s total sales of 2,592 is down 4.8% from March 2025, and 42% below the 10-year average for the month of March, based on HouseSigma transaction data. What’s more, it’s the second-slowest March for sales in our 24-year history of Metro Vancouver transactions, which is pulled from MLS records (with only March 2019 being even lower).
New supply is outrunning new demand
The infographic below shows that the sales-to-active listings ratio (the percentage of available homes that actually sell in a given month) stood at 13.4% in March 2026. Five years ago, in March 2021, it was 80.6%. That decline is the clearest single measure of how much the balance of power has shifted in Metro Vancouver’s market. More homes are competing for fewer buyers, and March’s seasonal sales lift did nothing to interrupt that trend.
While sales picked up month-over-month in March, new listings jumped faster. Some 7,858 homes came to market in March, a 23.2% increase from February, pushing active inventory to 19,316 at month’s end. This means supply is growing faster than it’s being absorbed. Greater Vancouver Realtors noted earlier this year that active inventory was running 37% above the 10-year seasonal average, and that gap has held through last month.
Prices are flat on a year-over-year basis
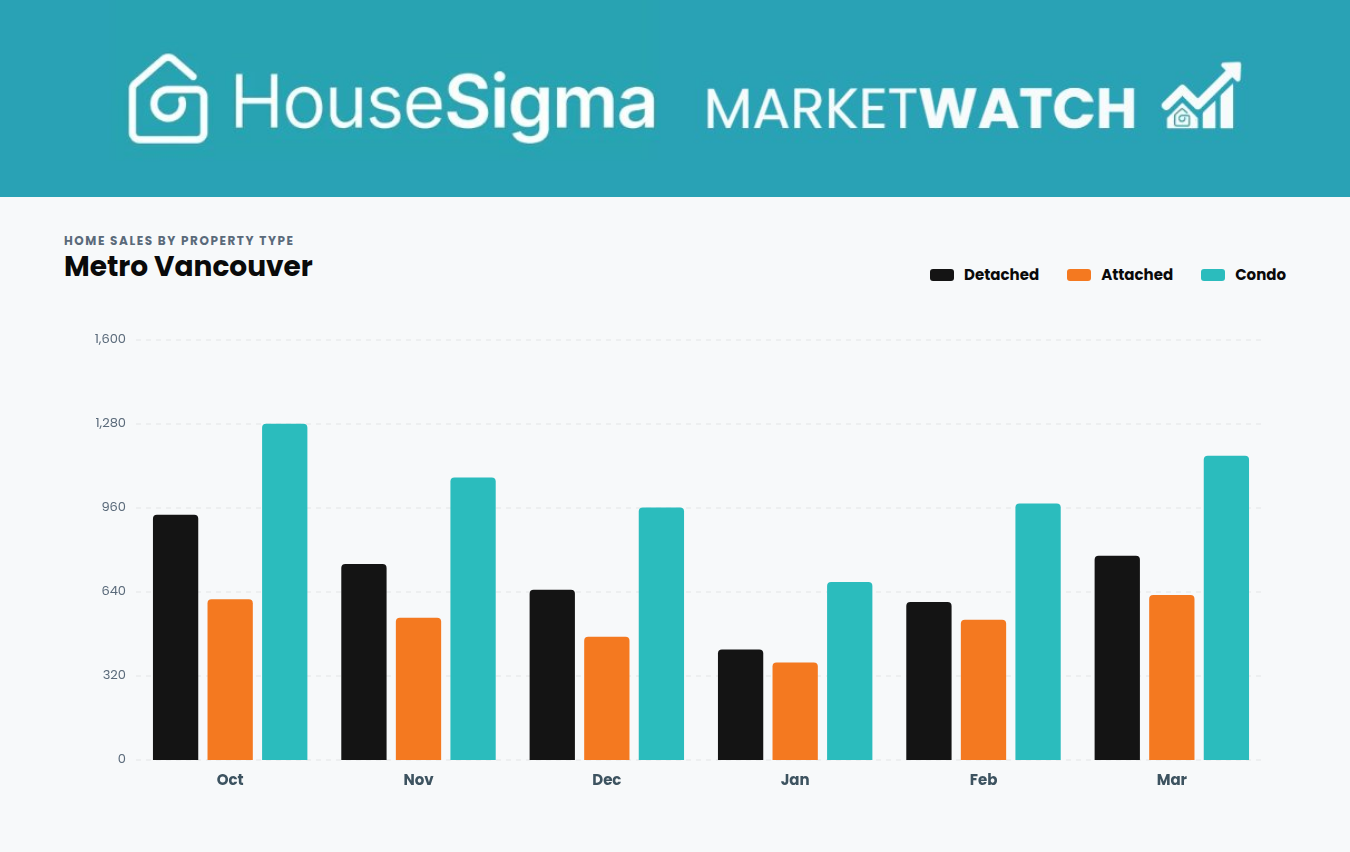
The overall median sale price reached $915,000 in March, up 2.9% from February and just 0.5% higher than one year previously. After 12 months of market activity, the overall price has moved by roughly $3,000. By property type, the year-over-year price picture is even softer: detached home prices fell 7.6% to $1,625,000, condos dropped 5.2% to $640,000, and attached homes came in at $960,000, down 5.4%.
Property days on market (which tracks how long a home has truly been trying to sell, including time from previous listings) remained elevated at 78 days in March. Homes that don’t sell in the first few weeks are clearly finding it hard to attract buyers. This is evidenced by the fact that terminated and expired listings rose year-over-year for both detached homes (+2.8%) and attached (+7.7%), adding to the picture of sellers struggling to find traction.
What this spring market actually means
Until there is a meaningful increase in sales activity — not just the seasonal bumps that come with warmer weather — prices are likely to remain subdued.
Sellers are listing their homes at price levels and volumes that reflect optimism about spring. Buyers, facing economic uncertainty and no particular urgency, are moving at their own pace. The result is more inventory, modest transaction volumes, and sale prices that have softened and show little sign of increasing. For buyers, that’s a quiet market worth that could be worth taking advantage of, while negotiating power is in their hands. For sellers, it’s a reminder that the calendar turning to spring doesn’t automatically bring a frenzy of buying activity along with it.
Jeremy Bator, a leading HouseSigma agent in the Lower Mainland, said, “That 22% jump looks like a party, but it’s really just the market doing its usual spring fling. When you zoom out, we’re still in a slower, slightly buyer-leaning market. Sellers need to be sharp on price, realistic with expectations, and make sure their home shows like a 10, because marginal just gets lost in the mix.”
Check out the full March 2026 interactive MarketWatch infographic for Metro Vancouver below, including more breakdowns by property type and area. Hover or click on the data points to see the full detail.
Find all your market trends data for Metro Vancouver here and keep up to date with our BC real estate blog here.