As thoughts turned towards the holiday season in November, residential resale transactions in Metro Vancouver trended downwards both month over month and year over year. HouseSigma data shows that sales were down over 16%, and the median sale price dropped by nearly 4% compared with October.
Perhaps scared off by the slow market, fewer sellers listed their homes in November, with new listings plummeting 28% compared with the previous month. However, inventory was still high at more than 20,000 listings active across the region last month.
The high inventory and slowing sales caused increases in both average “days on market” (the number of days a current listing has been on the market) and average “property days on market” (which measures the total number of days a property has been for sale, including if it was delisted and quickly relisted).
In fact, November’s average of 85 property days on market is the joint-highest seen since HouseSigma began tracking this metric. This means that the average Metro Vancouver home is now taking 85 days to sell – taking into account any delisting and rapid relisting of properties, which is sometimes used to hide how long a home has truly been for sale.
Karen Grunlund, HouseSigma’s Managing Broker for BC, said, “With properties now taking an average of 85 days to sell—the longest we’ve tracked—this is undeniably a challenging market for sellers. But for buyers, it’s the perfect time to start your home search, with more inventory and negotiating power than we’ve seen in years.”
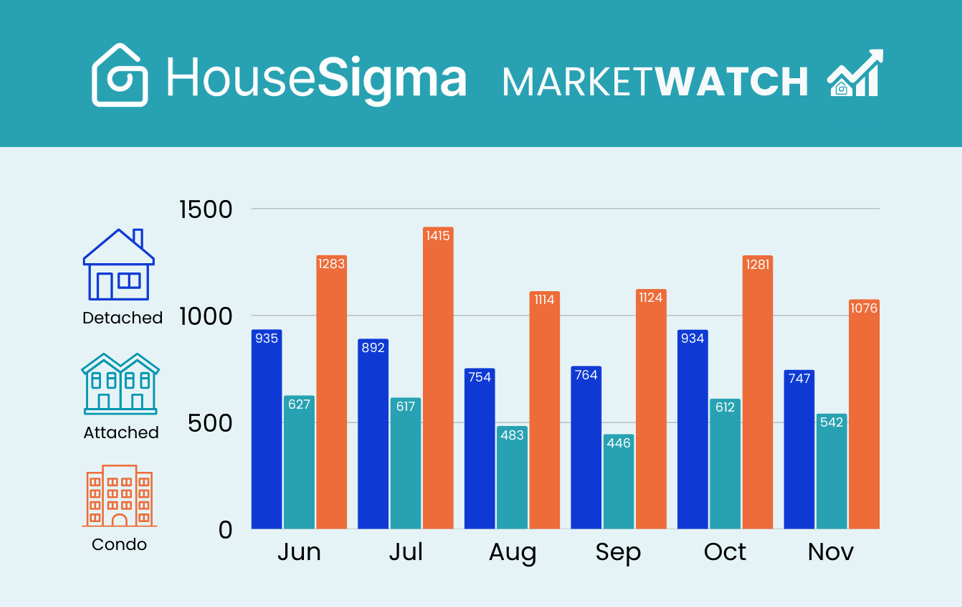
Check out the detailed Metro Vancouver market statistics in our infographic, below.

Find all your market trends data for Metro Vancouver here and keep up to date with our BC real estate blog here.