Introduction
The resale housing market experienced unprecedented upward price growth in Ontario and the Greater Toronto Area (GTA) during the pandemic. This was due to a combination of low interest rates, increased investor activity, and the shifting preferences due to thousands of Ontarians working from home. The market peaked in early 2022, as has started to trend downward over the past couple of months.
Ashkam Rahimi, the Director of Sales at HouseSigma Inc. described the market in January and February of 2022 as “Insane, with 10-15 competing offers on every listing, despite the fact that many prospective buyers had given up in late 2021 due to the frustration of being outbid.” However, Rahimi mentioned that “the slowdown that started in March has brought some of those frustrated buyers back to the table this year, as most listings are getting three or fewer offers, but buyers remain cautious.”
This report will look at data that backs up Rahimi’s anecdotal findings, showing the market peaked, with a pull-back in demand and pricing over since the beginning of March.
HouseSigma with the help of Bullpen Research & Consulting Inc. pulled together data on the median price of sales, the average days on market, total terminations, the termination rate, and the average price per-square-foot for condominiums in GTA and specific high-activity municipalities.
Median Pricing by Property Type
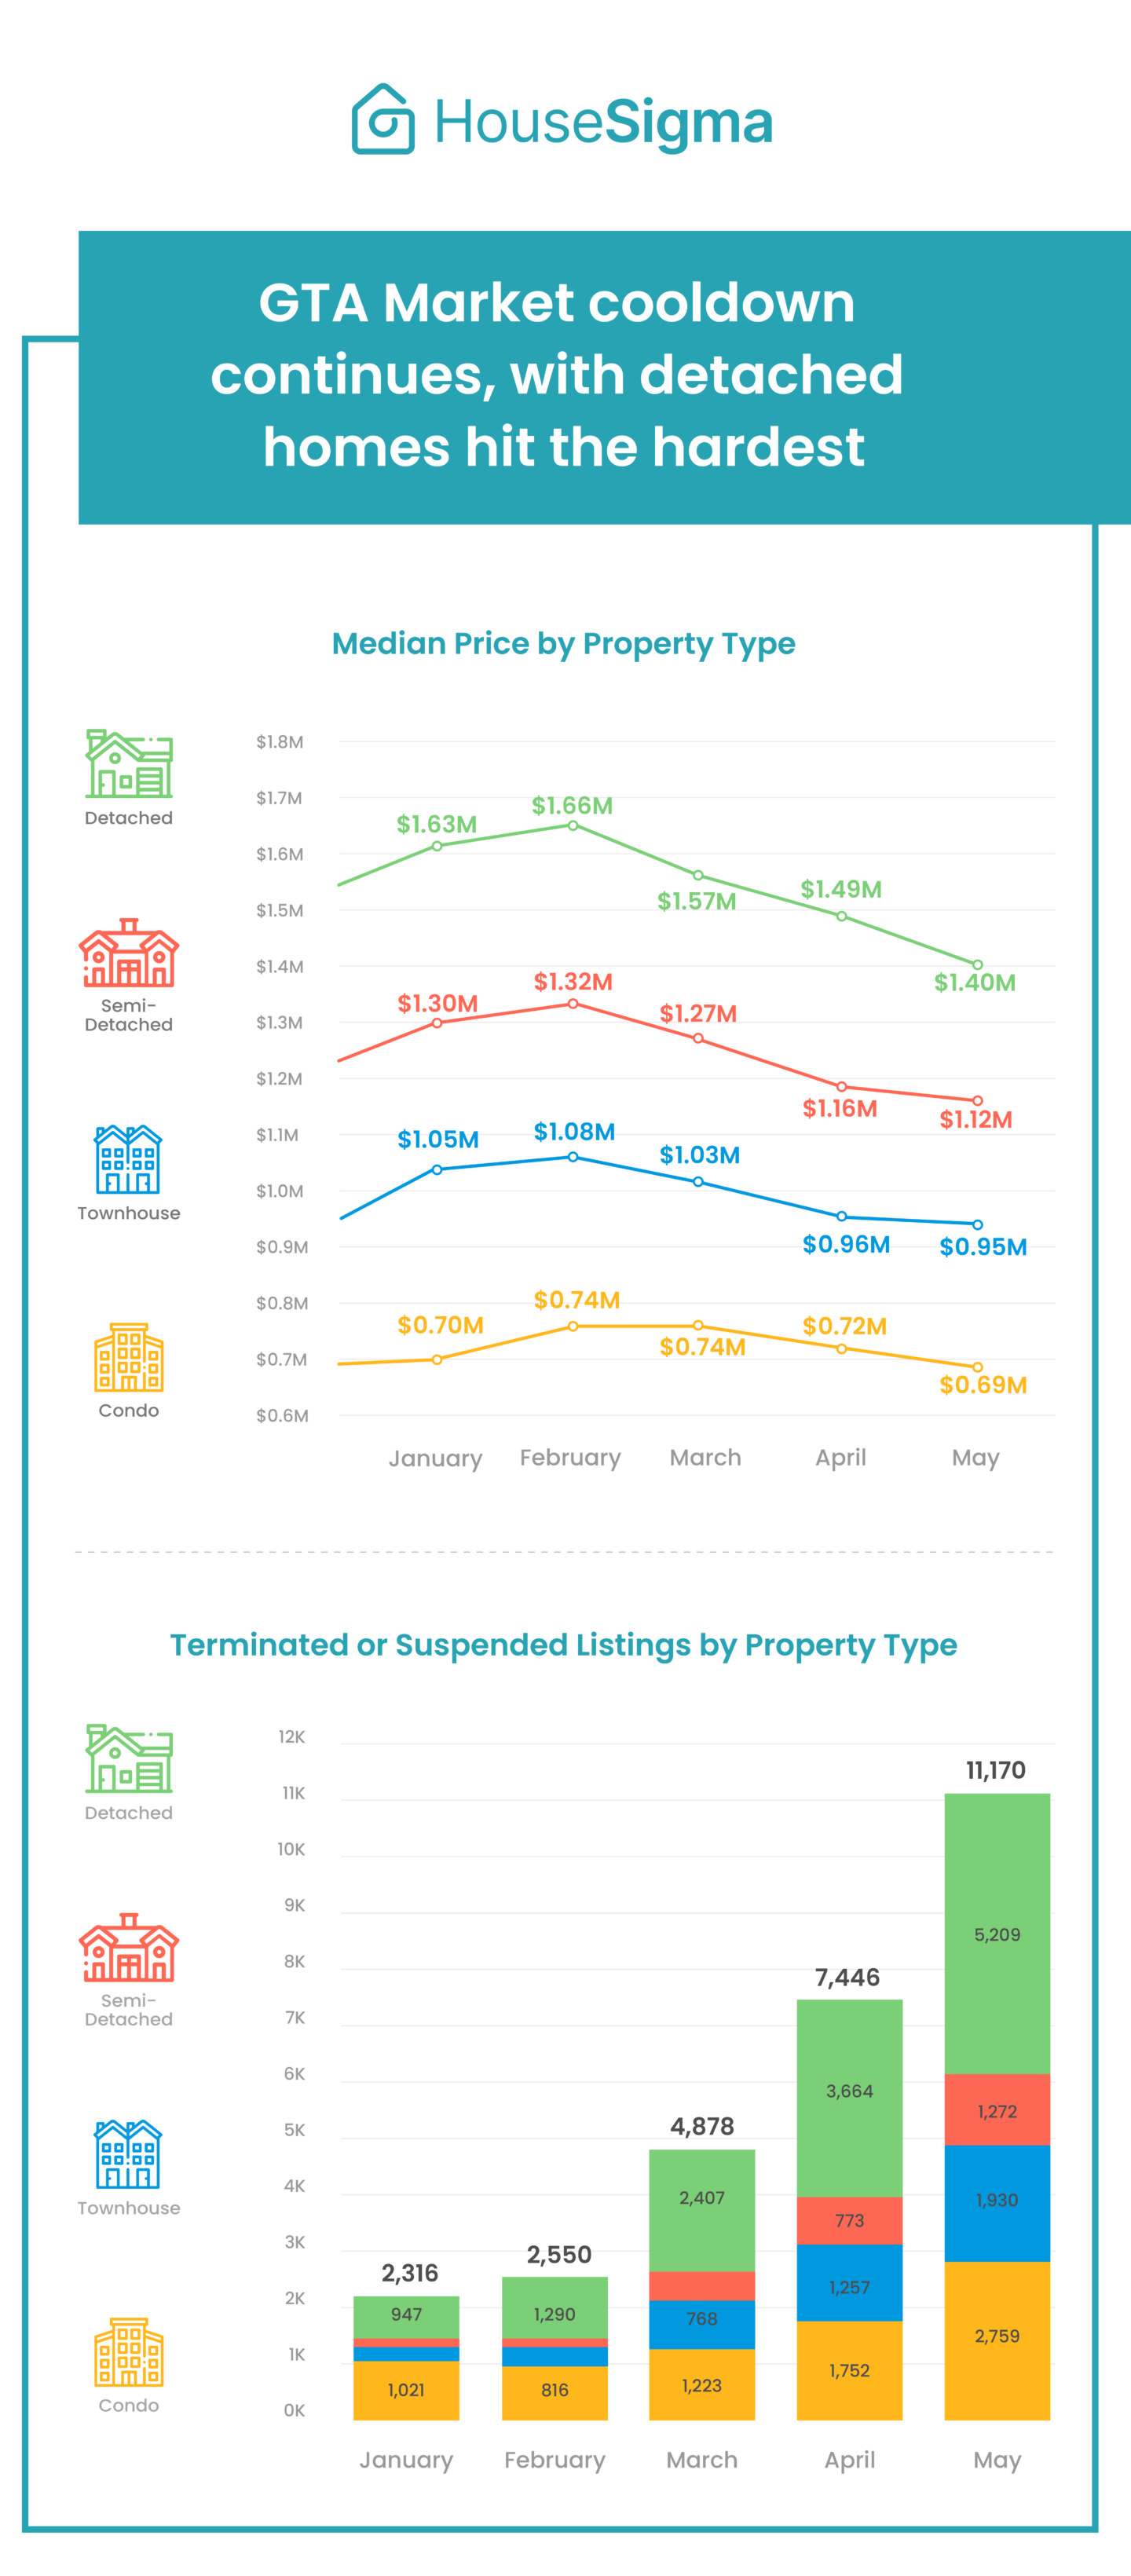
Figure 1 presents data on the median price of residential resale transactions in GTA by property type from the start of October to May 25, 2022.
The resale market has cooled off since the end of February, as all property types experienced declines in their median resale price between February 2022 and April 2022.
In May 2022 (first 25 days only), the median price has fallen further, with single-detached pricing down 5.8% month-over-month and 15.7% since February to $1.4 million.
Condominium apartments are faring slightly better than the other property types, with a monthly decline of 2.9% and a 6.2% decline since February to $690,000.

Monthly Change in Median Pricing for All Property Types
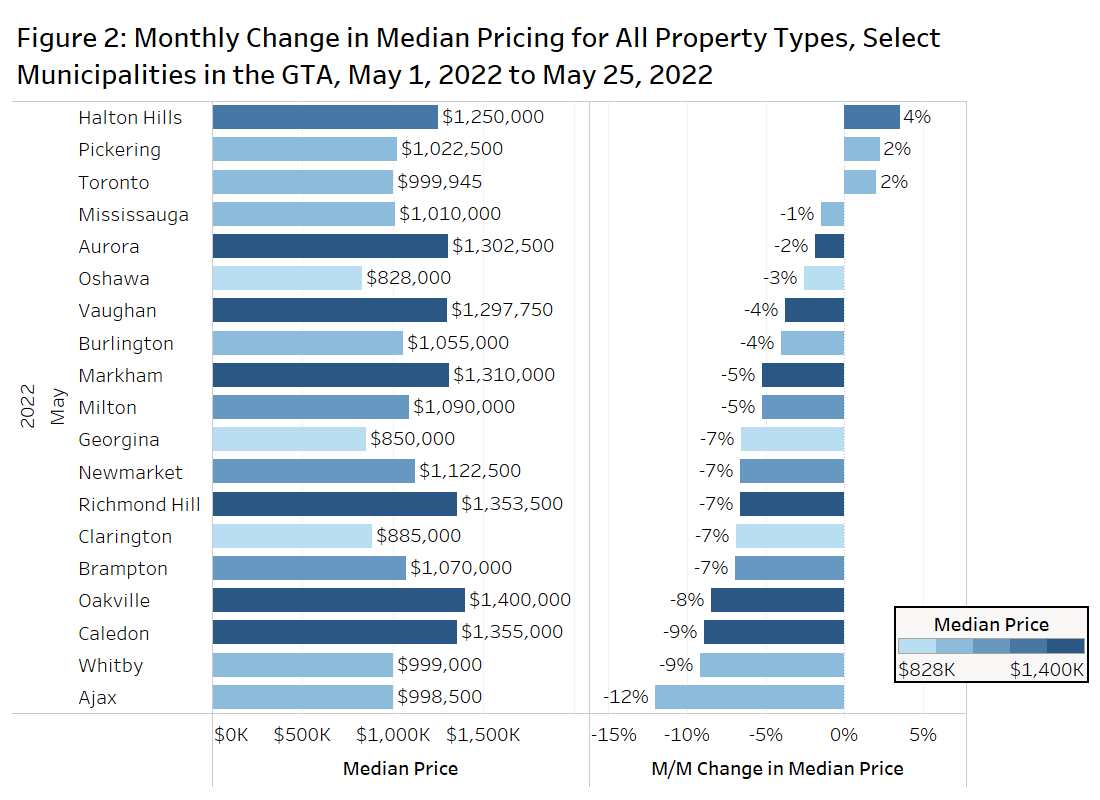
Figure 2 presents data on the median price and monthly change in median price for all property types for the most active municipalities in GTA by resale transactions in May 2022.
The municipalities experienced monthly increases, with Halton Hills up 4% over April, while Pickering and Toronto both rose by 2%. At the other end of the spectrum, Ajax experienced a substantial monthly decline of 12%, with Caledon and Whitby both down 9%.
Terminations by Month
If a property is not selling or receiving acceptable offers, a listing may get terminated, or essentially pulled from the market and relisted at a later date. An increase in terminations is an indication of a market softening.
Figure 3 looks at the total terminated or suspended listings in the GTA by month since October 2021.
During the peak of the market in the early part of 2022, terminations were at 2,329 in January and 2,575 in February. Through the first 25 days of May, there were 11,263 terminations, an increase of about 385% from January 2022.

Termination Rate by Property Type and Number of Bedrooms
The total number of terminations is a useful figure, but the total number of listings is also changing on a monthly basis, so looking at the share of listings terminated or “termination rate” is also an important number (ie, Total Terminations/Total Listings – because listings carry-over from month-to-month, it is possible to have a termination rate above 100%).
Figure 4 presents data on the termination rate by property type (top panel) and by the number of bedrooms (bottom panel). The data is broken out for Q4-2021 and Q2-2022, which is April and the first 25 days of May.
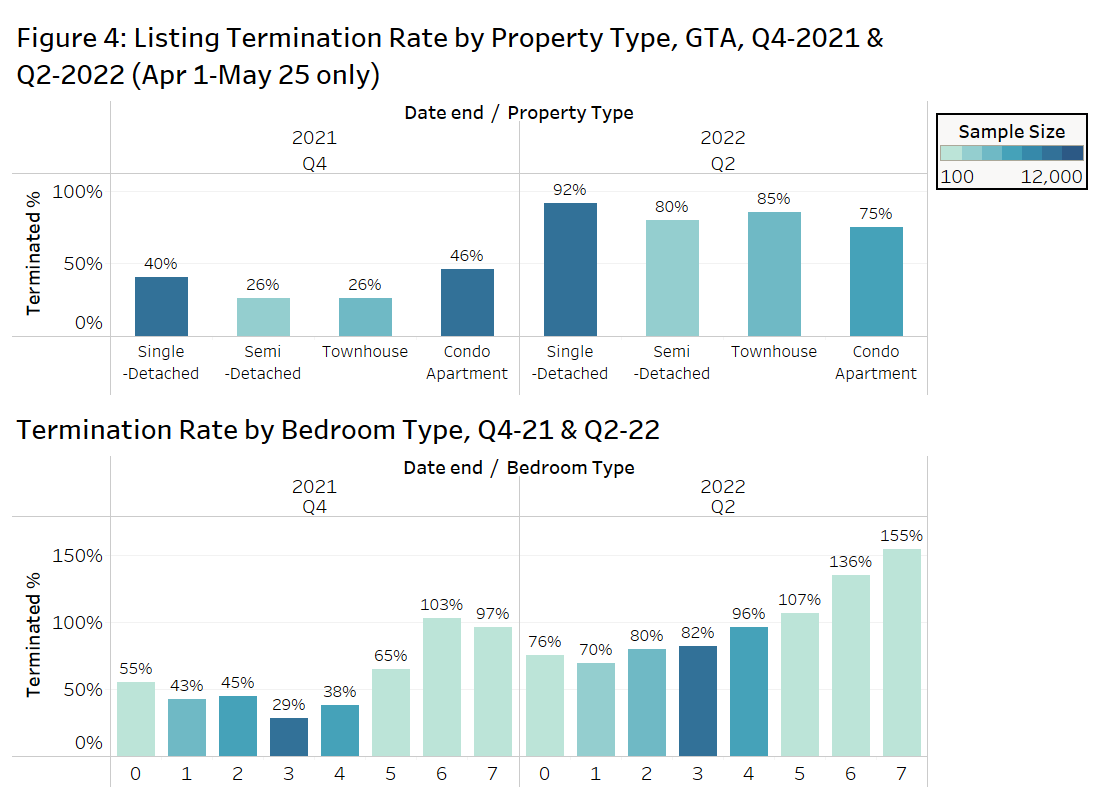
In the fourth quarter of last year, condos had the highest termination rate at 46%, with semis and Towns at 26% and singles at 40%. So far in the second quarter, the termination rate for single-detached homes has doubled to 92%, while the rate for condos is the lowest, but still much larger than last year at 75%.
On a bedroom type basis, the larger bedroom types generally had higher termination rates in Q2-2022, with five, six and seven bedroom homes having rates above 100%, meaning there are more terminations than listings for those homes.
Termination Rate by Municipality
Figure 5 looks at select municipalities in the GTA with at least 200 listings since March, and looks at the termination rate in those markets.
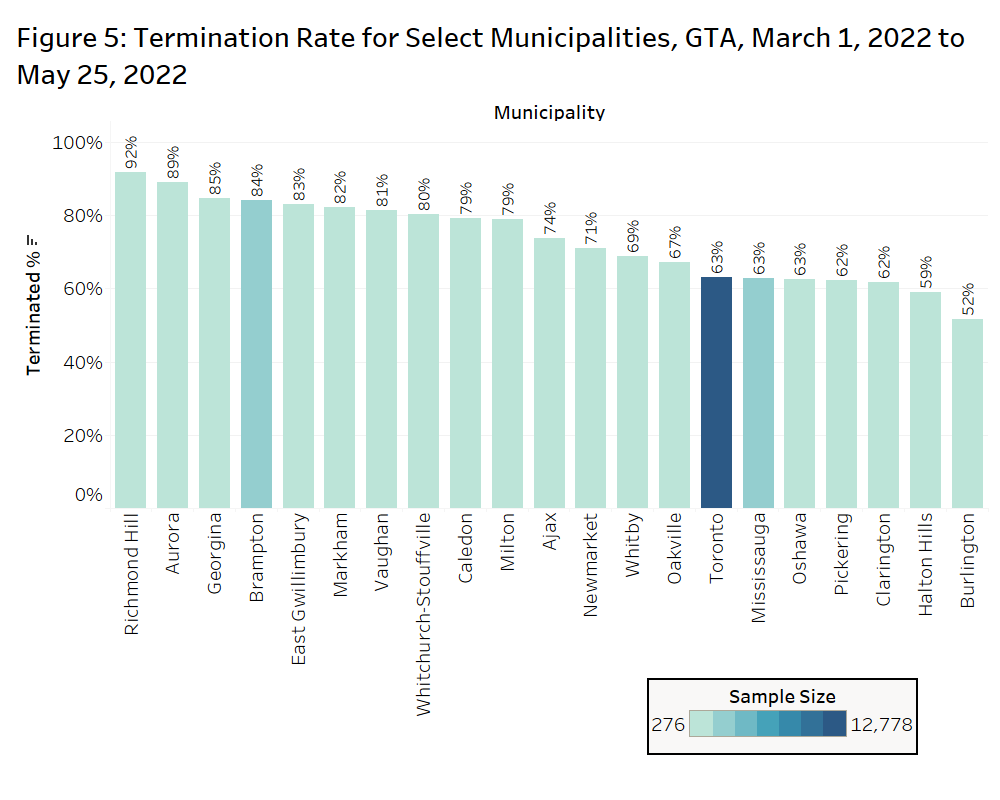
York Region municipalities are experiencing the highest rates with Richmond Hill at 92%, Aurora at 89% and Georgina at 85%. The City of Toronto remains in the second half of the municipalities at 63%, with Burlingon faring the best at 52%.
Days On Market by Bedroom Type and Property Type
Figure 6 presents data on the average and median days on market by property type and bedroom type in GTA for March, April, and May 2022.
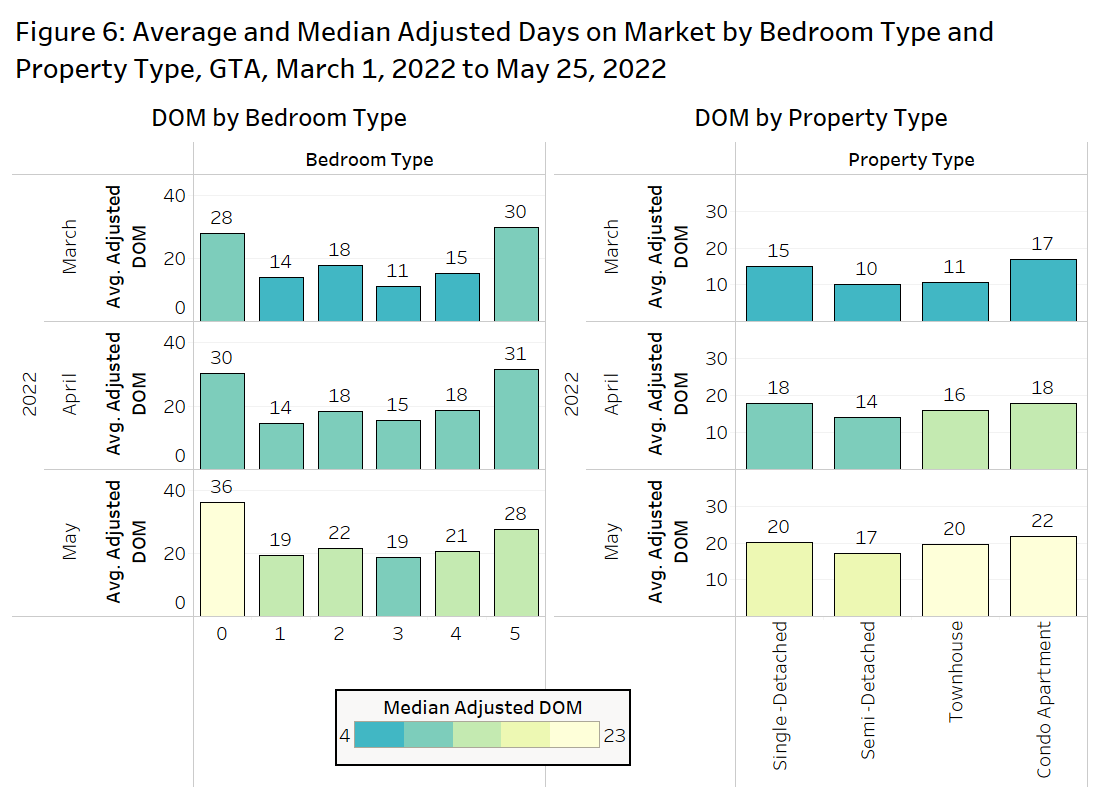
The average number of days on market has continued to increase each month, implying that it is taking longer to sell units of all bedroom types. Studio units stand out as the bedroom type that has the highest average days on market in May 2022 at 36 days, while one and three bedroom units had the lowest average days on market at 19.
The average number of days on market across all property types has also continued to increase between March 2022 to May 2022. Condo apartment units had the highest average adjusted DOM in May (first 25 days only) at 22 days, while semi-detached units had the lowest average adjusted DOM at 17.
Condominium Price Per-Square-Foot by Municipality
The following chart looks at per-square-foot pricing for Toronto and Mississauga by bedroom type and month (refer to Figure 7).
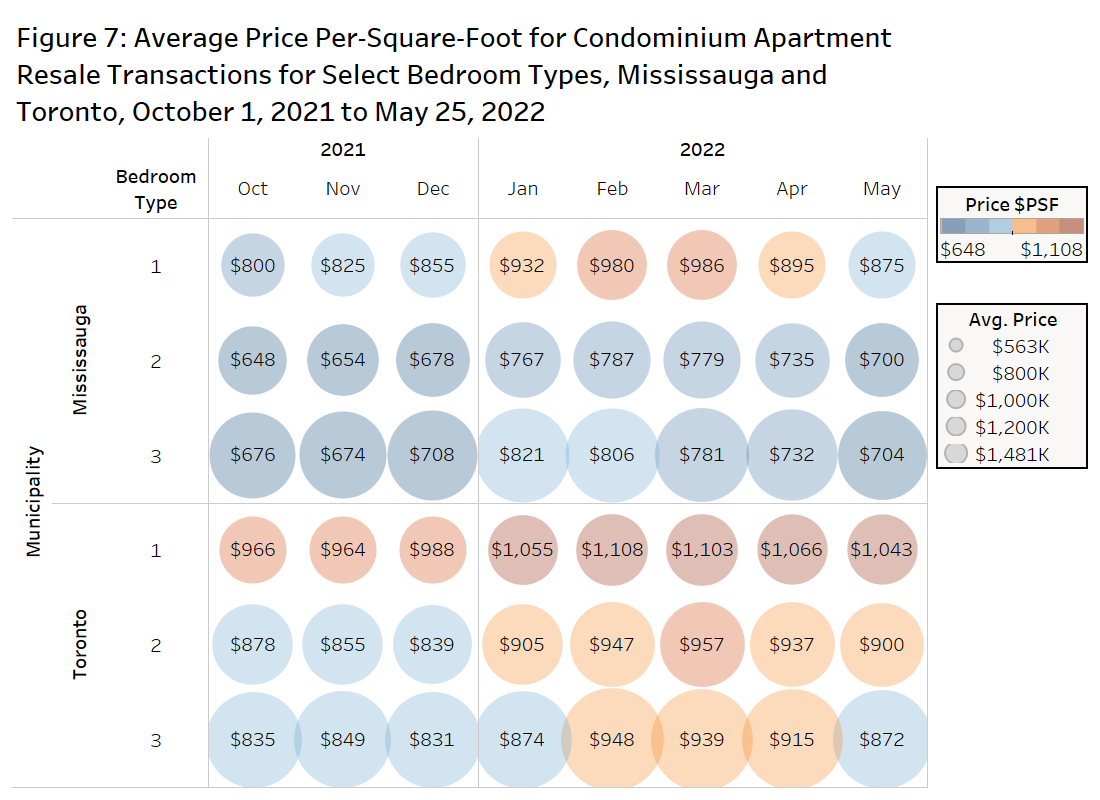
Both Mississauga and Toronto have seen their average per-square-foot prices slowly decline between March 2022 to May 2022 for one, two, and three bedroom condo apartments.
One bedroom condo apartments in Mississauga had an average price of $875 psf in May 2022, while two bedroom condo apartments had an average price of $700 psf, and three bedroom condo apartments had an average price of $704 psf. In February, those rates were $980 psf, $787 psf and $806 psf, down 11% to 13%.
One bedroom condo apartments in Toronto had an average price of $1,043 psf in May 2022, while two bedroom condo apartments had an average price of $900 psf and three bedroom condo apartments had an average price of $872 psf. Per-square-foot prices are down 5% to 8% from the February peak levels.
Conclusion
After several hot months, the resale market has cooled significantly since February, as all property types have experienced declines in their median resale price. The median price of a single-detached property is down by nearly 16% since the market peak.
The number of terminated listings also increased substantially in May 2022, rising by over 380% since January. These terminations appear to be occurring more frequently in the York Region, with the bedroom communities in the outlying areas of the GTA experiencing the lowest buyer demand currently.
Rahimi of HouseSigma mentions that sellers want to know where their buyers are coming from if they have an existing home to sell, which is an indication that there is currently worry about the direction of the market moving forward, especially in ‘B’ or ‘C’ locations.
The average days on market has also increased across all bedroom types and property types over the past couple months. The figures are still reasonable, suggesting some sellers have already adjusted to market realities and are looking to move their homes quickly.
The condominium resale market appears to be faring much better than the single-family market currently, but it is still location-specific. The price per-square-foot for condos in Mississauga is down about 11% from the peak, while Toronto is only down by about 6%.
The data from early 2022 suggested the market was quite frothy, and the current slowdown is likely better for everyone in the industry. HouseSigma and Bullpen expect a much more balanced market moving forward.