Skip to content
HouseSigma

HouseSigma

  • Homepage
  • Blog
  • Contact Us
  • FAQ

Tag: Median Price

View of Calgary and the wider mountainous region from above

Starter condos to family homes: What $500K buys you in Calgary and the wider region

January 27, 2026 Joannah Connolly AB, Real Estate

With Greater Calgary’s median home sale price in 2025 standing at $578,000, it’s reasonable to think that $500,000 would be a solid budget for a

Read more
Median price graph from the HouseSigma GTA PriceWatch full-year 2025 infographic

Infographic: GTA luxury home sector falters, with one mansion selling $12.2M under first asking price

January 21, 2026 Joannah Connolly ON, Real Estate

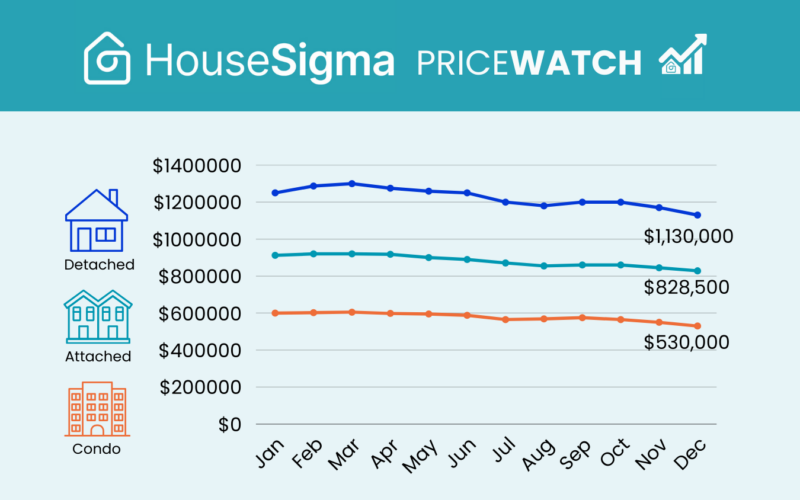
If you want an example of how the luxury real estate sector has been rapidly softening in the Greater Toronto Area, one very revealing cautionary

Read more
Graph of median sale prices from Metro Vancouver 2025 full-year PriceWatch infographic

Infographic: Metro Vancouver luxury home sellers forced into deep discounts under list price, up to $5.88M

January 19, 2026 Joannah Connolly BC, Real Estate

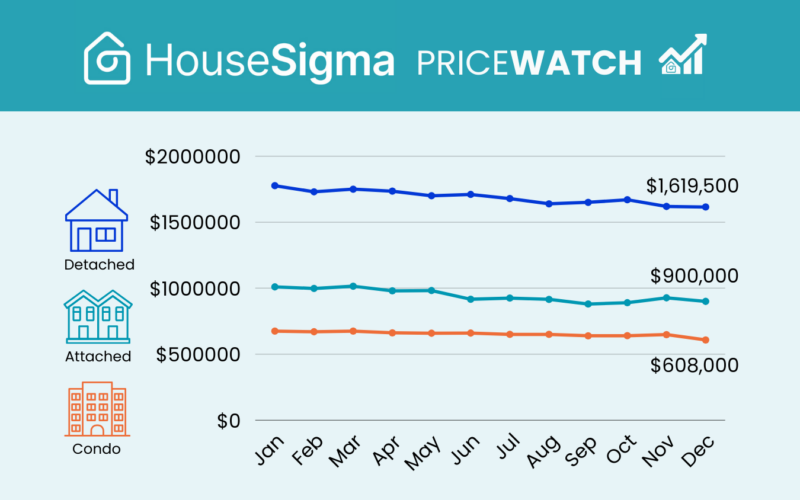
For the home seller who last year had to take $5.88 million less than they wanted on their luxury West Vancouver mansion, the depth of

Read more
Median price graph from Edmonton PriceWatch 2025 full-year infographic

Infographic: Greater Edmonton home prices rose in 2025, bucking national trend

January 15, 2026 Joannah Connolly AB, Real Estate

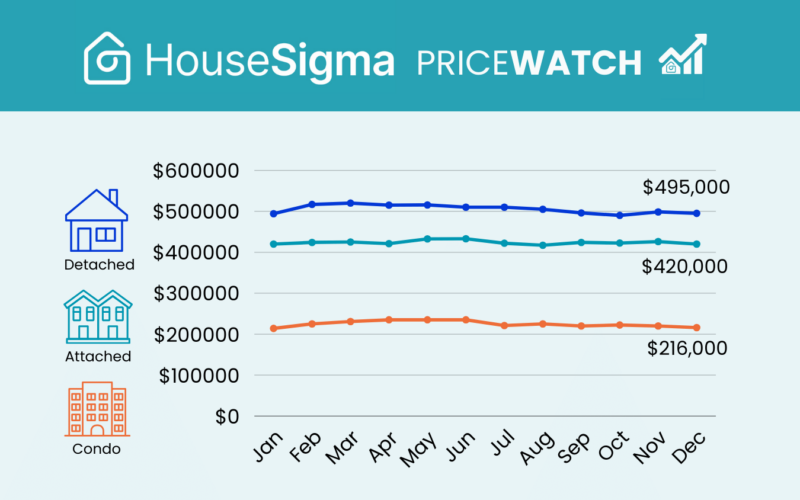
Despite the drop in home sales across Edmonton in 2025, sale prices in the region did not similarly falter, new full-year data from HouseSigma has

Read more
Graph of sale prices from Greater Calgary PriceWatch full year 2025 infographic

Infographic: Greater Calgary median home sale prices hold fast in 2025 while other cities tumble

January 13, 2026 Joannah Connolly AB, Real Estate

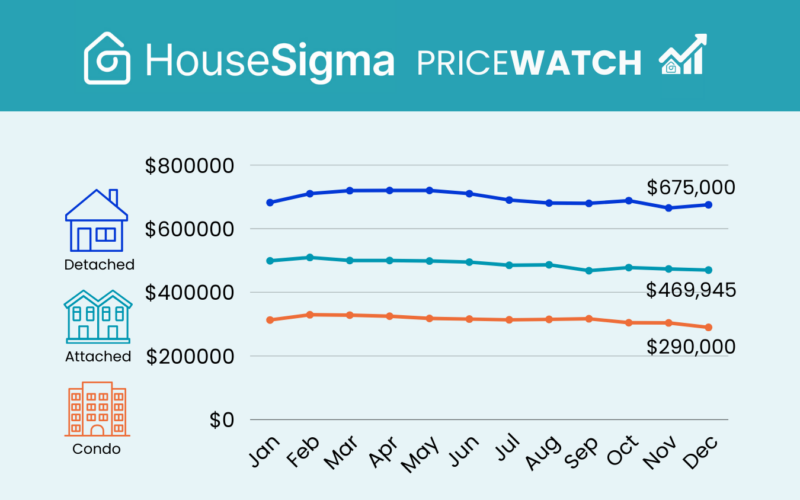
While home prices fell last year amid plummeting sales in Metro Vancouver and Greater Toronto, the median price of a Greater Calgary home sale in

Read more
Home sales graph taken from the GTA MarketWatch full-year 2025 infographic

Infographic: Only half of homes listed in the GTA in 2025 were sold

January 7, 2026 Joannah Connolly ON, Real Estate

If you were hoping to sell your home in the Greater Toronto Area last year, you only had about a 50:50 chance of success, new

Read more
Metro Vancouver MarketWatch infographic graph, showing the full year of home sales in 2025

Infographic: 2025 was Metro Vancouver’s slowest home sales year on record

January 5, 2026 Joannah Connolly BC, Real Estate

Metro Vancouver homes in 2025 sold at the slowest pace on HouseSigma’s 23-year record, both in terms of sales volumes and average time to sell,

Read more
Graph from Metro Vancouver monthly PriceWatch infographic

Infographic: Nine in 10 Metro Vancouver homes selling for under list price

December 15, 2025 Joannah Connolly BC, Real Estate

Nearly nine in 10 Metro Vancouver homes sold last month went for below list price, with a median drop of 3% under asking, a new

Read more
Graph taken from HouseSigma's GTA MarketWatch infographic, November 2025

Infographic: GTA homes taking longer than ever to sell, while prices keep slipping

December 12, 2025 Joannah Connolly ON, Real Estate

Home buyers in the Greater Toronto Area are enjoying huge advantages in the residential real estate market right now, as new data from HouseSigma reveals.

Read more
Graph of home sales from HouseSigma's Metro Vancouver MarketWatch infographic, November 2025

Infographic: Metro Vancouver home sales slow and prices slide ahead of holiday season

December 3, 2025 Joannah Connolly BC, Real Estate

As thoughts turned towards the holiday season in November, residential resale transactions in Metro Vancouver trended downwards both month over month and year over year.

Read more

Posts navigation

«Previous Posts 1 2 3 Next Posts»
HouseSigma Inc. Brokerage Legal Privacy & Security Terms & Conditions Accessibility