Although Greater Edmonton’s residential resale prices have defied national trends by holding firm throughout 2025, multiple market indicators are pointing to the region following other major Canadian cities in seeing home price declines over this year.
New HouseSigma data analysis on January 2026 market statistics (see infographic below) show a series of six market trends that were also seen recently in Greater Toronto, Metro Vancouver, and Greater Calgary prior to residential resale prices declining in those regions.
1. Sales have dramatically declined: HouseSigma’s sales data shows Greater Edmonton sales fell 26.3% year-over-year, from 1,592 to 1,173. The RAE’s official Greater Edmonton figure is similar, a decrease of 27.6 per cent compared with January 2025. When sales drop, prices usually follow, often with a three- to six-month lag.
2. Inventory is surging: Realtors Association of Edmonton reports 4,901 active listings in January, 32.7% higher than January 2025. The slowing of sales combined with new listings coming on stream has exponentially increased inventory levels.
3. Market absorption is plummeting: The sales-to-active listings ratio puts Greater Edmonton firmly into buyers’ market territory. This ratio is a leading indicator of where prices are heading, as when buyers have the upper hand, prices inevitably fall.
4. Homes are taking much longer to sell. Average cumulative days on market lengthened to 90 days, from 71 a year earlier. The longer homes take to sell, the more prices have to eventually fall — and the less pressure buyers have on them to pay full price.
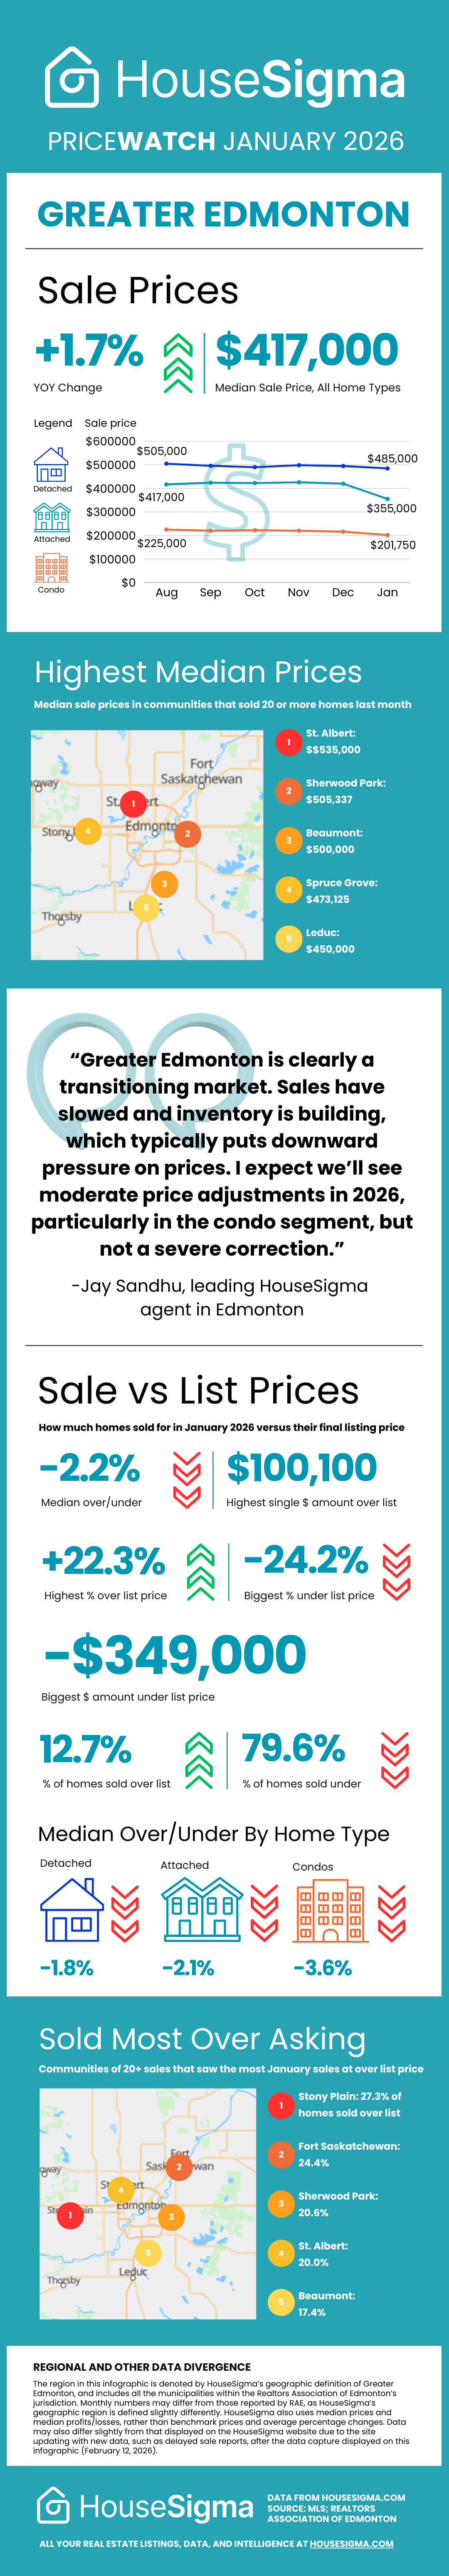
5. The share of homes selling above asking has collapsed, while below asking has risen: Our infographic shows only 12.7% of January 2026 sales went over asking, while 79.6% sold below list. This below-list proportion has dramatically increased compared with same metric across all of 2025.
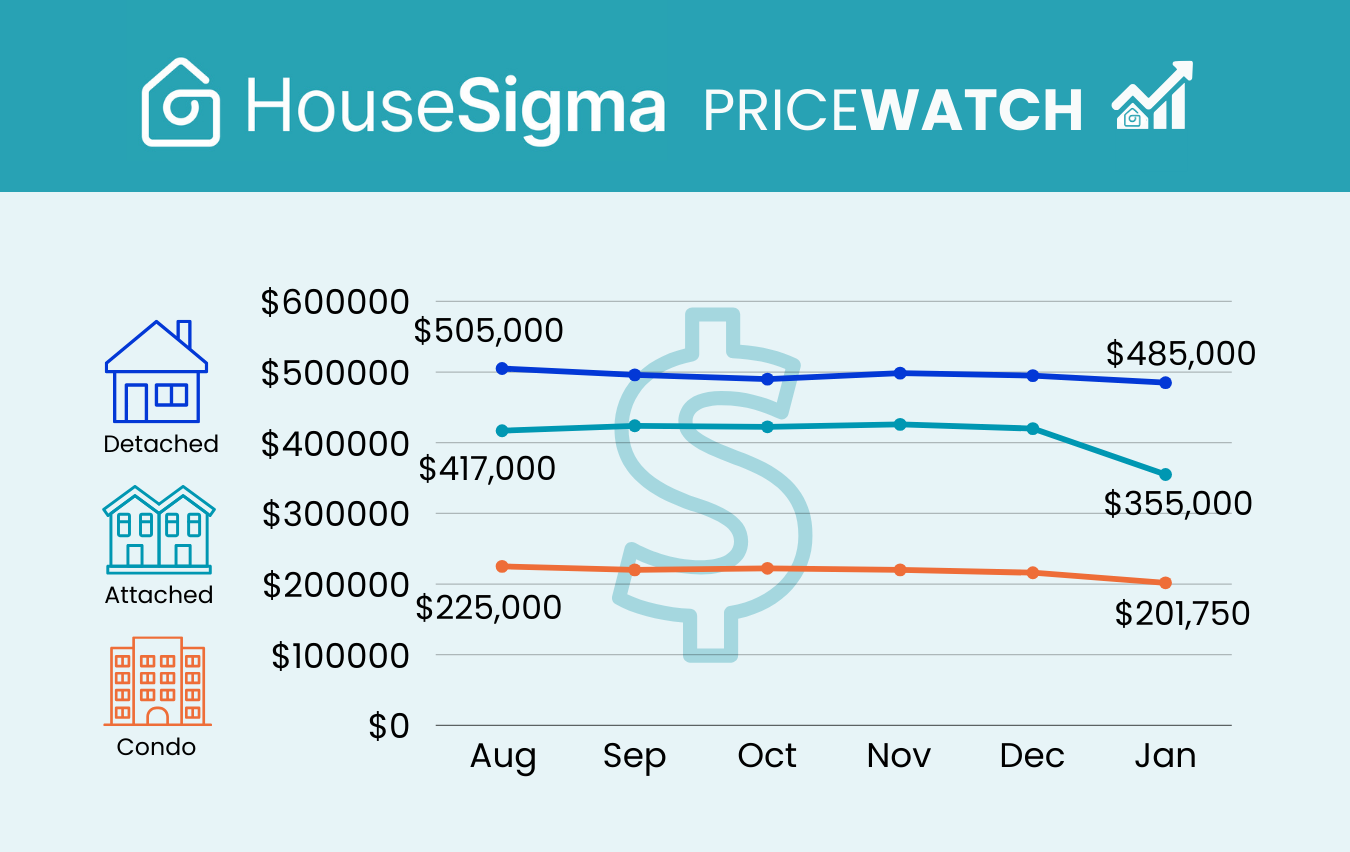
6. The benchmark price has already started to crack: While median prices in HouseSigma data still show small year-over-year gains, the MLS Home Price Index — which controls for the mix of homes selling — tells a different story. RAE reports that the composite benchmark price in Greater Edmonton was $415,000, decreasing 0.1% from December 2025 and 1% year-over-year.
“Greater Edmonton is clearly a transitioning market. Sales have slowed and inventory is building, which typically puts downward pressure on prices. I expect we’ll see moderate price adjustments in 2026, particularly in the condo segment, but not a severe correction. Affordability and steady demand fundamentals should help prevent a dramatic drop.”
Jay Sandhu, leading HouseSigma agent in Edmonton
Even the notable market outliers are demonstrating lower over-asking extremes. The home that sold in January for most over asking price, by both dollar amount and percentage, was this 1970s Sherwood Park house. It sold for $100,100 over its $449,900 asking price, which was a 22.2% premium — generous, but not as high as some of the outliers we saw in the region last year.
The residential property that went for most under asking by dollar amount was an architecturally striking five-bedroom house in the Heritage Valley area, which sold for $349K less than its $2,499,000 list price. By percentage amount, the home that lost the most was a manufactured home in Gibbons, the final sale price of $75K being 24.2% lower than its $94,900 asking price.
Check out the January 2026 Greater Edmonton PriceWatch infographic below for more real estate market data, including breakdowns by property type and municipality.
Keep your eye on our Alberta blog page to stay up to date with market trends, sales data, and remarkable listing stories.