
For years, real estate websites have shown their users how popular a listing is by showing clicks and saves. These are interesting, but they can often represent curiosity rather than commitment.
Even surfacing page views can inflate interest with casual scrolling, duplicate visits, and bots, adding more noise than signal. Many platforms surface that metric because it’s easy to collect, but almost no platform distills it into something a buyer can actually use to gauge real intent.
When it’s time to act, most buyers still rely on hearsay (“multiple offers”) or agent-only dashboards, none of which give you as a buyer a clean read on the likely competition for a home.
Introducing HouseSigma competition-level estimates
HouseSigma has earned its reputation by giving buyers the facts they need to make a decision on their home purchases (such as the full listing history and true property days on market, see Business in Vancouver article, Western Investor article).
Now we’re extending that approach with a tool that estimates buyer competition for each property, shown directly on eligible Ontario listings under “Buyers who have likely toured this home.”
This tool displays two concise figures: the AI-estimated number of people who toured the home in the last 7 days and the number of tours since listed. This data translates noisy page views into a practical signal about real-world interest, so buyers can gauge the competition and plan their next step.
Why these insights matter to buyers
Real estate has long asked buyers to make big decisions in a fog. We’ve seen how skepticism creeps in when buyers have to rely solely on what listing agents say about interest and offers. Our goal is to replace ambiguity with useful, interpretable signals so that you as a buyer can act with more confidence, not more pressure. That’s why we’re putting this information in front of buyers, not tucked away in a dashboard for industry pros.
Why “page views” aren’t enough
Page views are everywhere online, including real estate. They’re easy to measure and they help with discovery but they blur window-shoppers with serious buyers.
In our own data, we’ve seen that our “popularity index” on listings – which compares that listing’s page-view popularity with other similar listings – tells buyers something directionally, but it’s not the right yardstick for real competition for that property. Popularity can occur on a listing for many reasons (such as a social media post or news article highlighting the listing for a specific reason) and doesn’t mean a lot of people are interested in actually buying it.
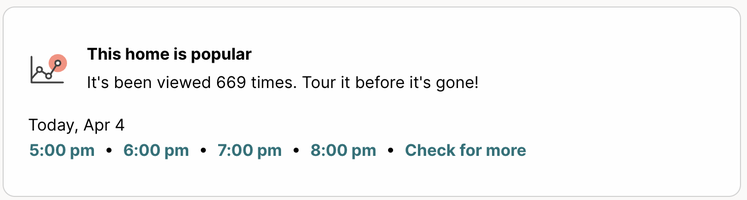
Internally, we found this kind of relative popularity showed a weak correlation with actual scheduled viewings – which is exactly the gap we set out to close. And it isn’t just the case for HouseSigma: other listings websites reveal a similarly weak correlation, as shown in this screenshot in which a supposedly popular listing has many viewing times available.
So we reframed the question buyers are really asking:
“I’m interested in this property, how many other serious buyers am I up against right now?”
To answer that, we anchored on tours. Attending a tour is a strong, high-intent signal on the path to making an offer, far more telling than a quick scroll. In our problem exploration, we documented tours as the clearest signal for “serious interest” compared to softer signals like listing visits: noise.
What buyers see on HouseSigma
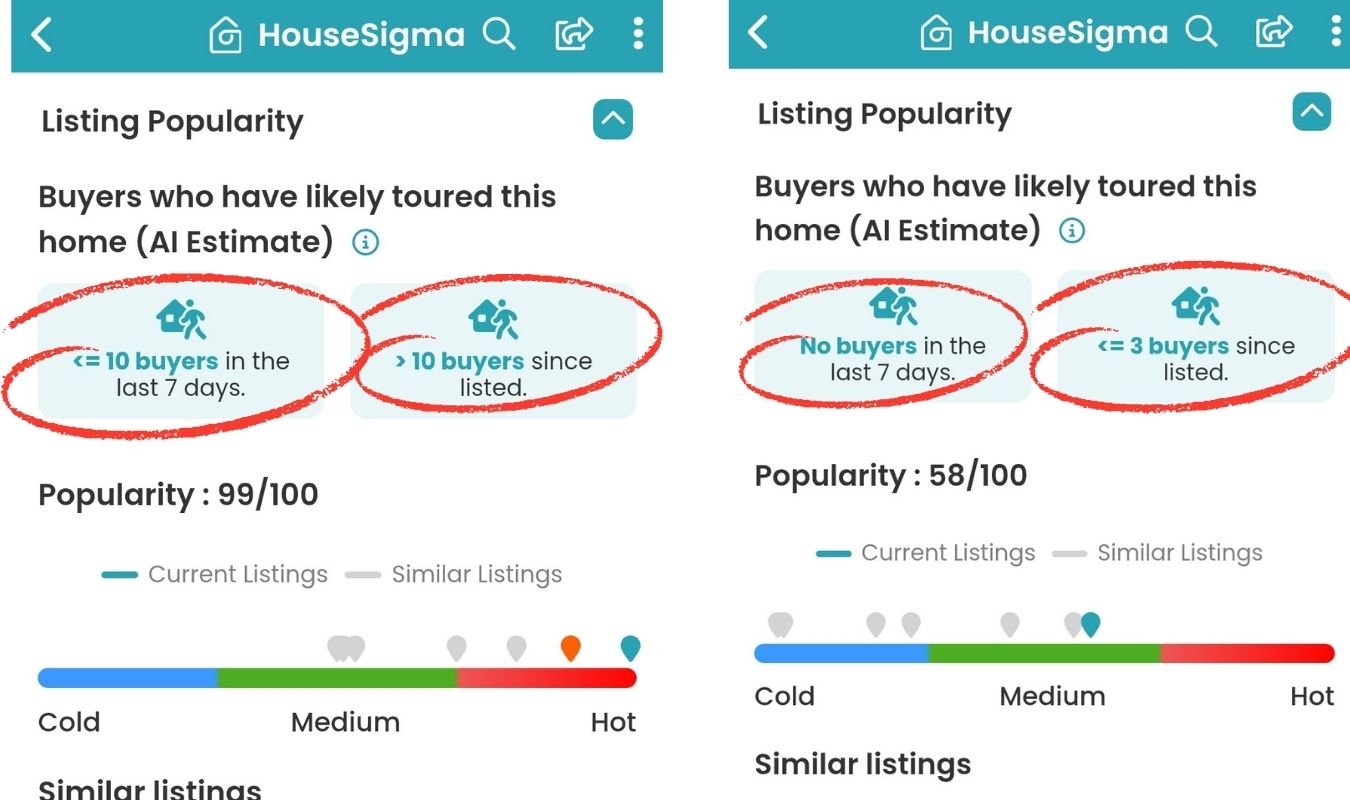
On most active sale listings in Ontario, after scrolling down to the “Comparables” section, buyers will now see a small module labeled “Buyers who have likely toured this home.” It surfaces two numbers:
- In the last 7 days: Number of buyers who have likely toured this property in the last 7 days
- Since listed: Number of buyers who have likely toured this property since it was listed
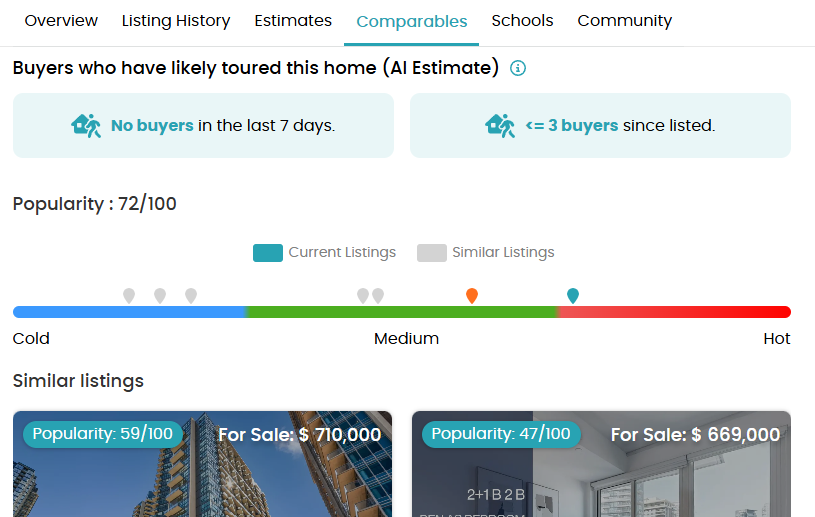
These aren’t raw counts of website clicks. They’re AI estimates of likely tours, expressed as easy-to-scan chips right on the listing page. Our Machine Learning models combine momentum in listing attention, overall buyer traffic, and the property’s profile among other signals to estimate how many people likely toured. The estimates are calibrated on unseen data to avoid overfitting to any one listing. But why do we show two timeframes? Because they answer two different questions buyers might have:
- Last 7 days: “How hot is this home right now?”
- Since listed: “How much serious interest has built up over the entire on-market period?”
Together, these help buyers calibrate urgency (book a showing sooner vs. later), and they can frame buyers’ offer approach (should we compete assertively or look for negotiation room?).
What it is and what it isn’t
- It’s about real-world intent. We focus on tours because they’re a meaningful step between casual browsing and writing an offer.
- It’s an estimate, not a claim of registered offers. We’re not declaring exact numbers of people who toured the home, or how many offers exist or what they’ll be. We’re simply giving buyers a signal on serious buyer activity so they can plan their next move.
- It’s transparent about scope. We’re starting with Ontario sale listings where HouseSigma is a dominant player in the market. The AI estimate needs to work in an area where there is a high market share of users.
How to interpret the information
Now that you know what you’ll see on HouseSigma’s buyer competition tool, how do you interpret the data to inform your homebuying strategy?
Here are a few scenarios:
- High number of tours in the last 7 days, modest numbers since listed: That can hint at fresh momentum, such as a price reduction or new attention from external sources. Ask your agent about this, and check the listing for price changes.
- Low in the last 7 days, low since listed: Not every quiet listing is a problem; sometimes it’s an opportunity.
- Low in the last 7 days, medium-high since listed: This is a listing that likely had momentum to start with, but has tailed off without a sale. You may be able to capitalize on this.
- High both ways: If you are interested in buying this property, you should expect company.
Last but not least, context matters. Markets swing between hot and cool cycles, buyers don’t distribute evenly across similar homes, and the offer landscape can change quickly. The count is a strong input, but it is far from the entire picture.
A quick note on the data
- Freshness: We update our estimates every day based on the data we collect on HouseSigma. We’ve designed the experience with sensible fallbacks and freshness expectations, and we monitor the integration closely. If data that we can be reasonably confident in isn’t available, we avoid misleading buyers with partial or stale numbers, and the tool will not show on that listing. The point is to help buyers decide, not to distract or misinform them.
- Estimates vs exact: These numbers are estimates, based on user data from HouseSigma and AI models trained on our proprietary data (i.e. home tours booked through HouseSigma) and infer the count of tours booked on any listing every day. That being said, buyers have many opportunities at their disposal to tour a home, and we’re aware that we can’t capture all of that signal.
Try it for yourself
Buying a home is one of the highest-stakes decisions most of us make. As a buyer, you deserve clarity when it comes to competition. With likely tour counts on eligible Ontario listings, you now have a useful step toward that clarity. Fewer question marks, better timing, smarter strategy.
Give it a spin the next time you’re browsing Ontario listings on HouseSigma. And if you’ve got thoughts, we’re listening; this feature came directly from buyer feedback and field research, and we plan to keep tuning it based on what helps buyers most.